Micron Stock Nears $1,000 After 671% Rally — But Caution Flags Rise

0
0

Micron Stock (MU) closed at $995.87 on June 11, just shy of the $1,000 psychological barrier. The daily chart confirms a powerful bull trend — up over 671% in the past year. Yet short-term signals suggest caution before chasing the rally.
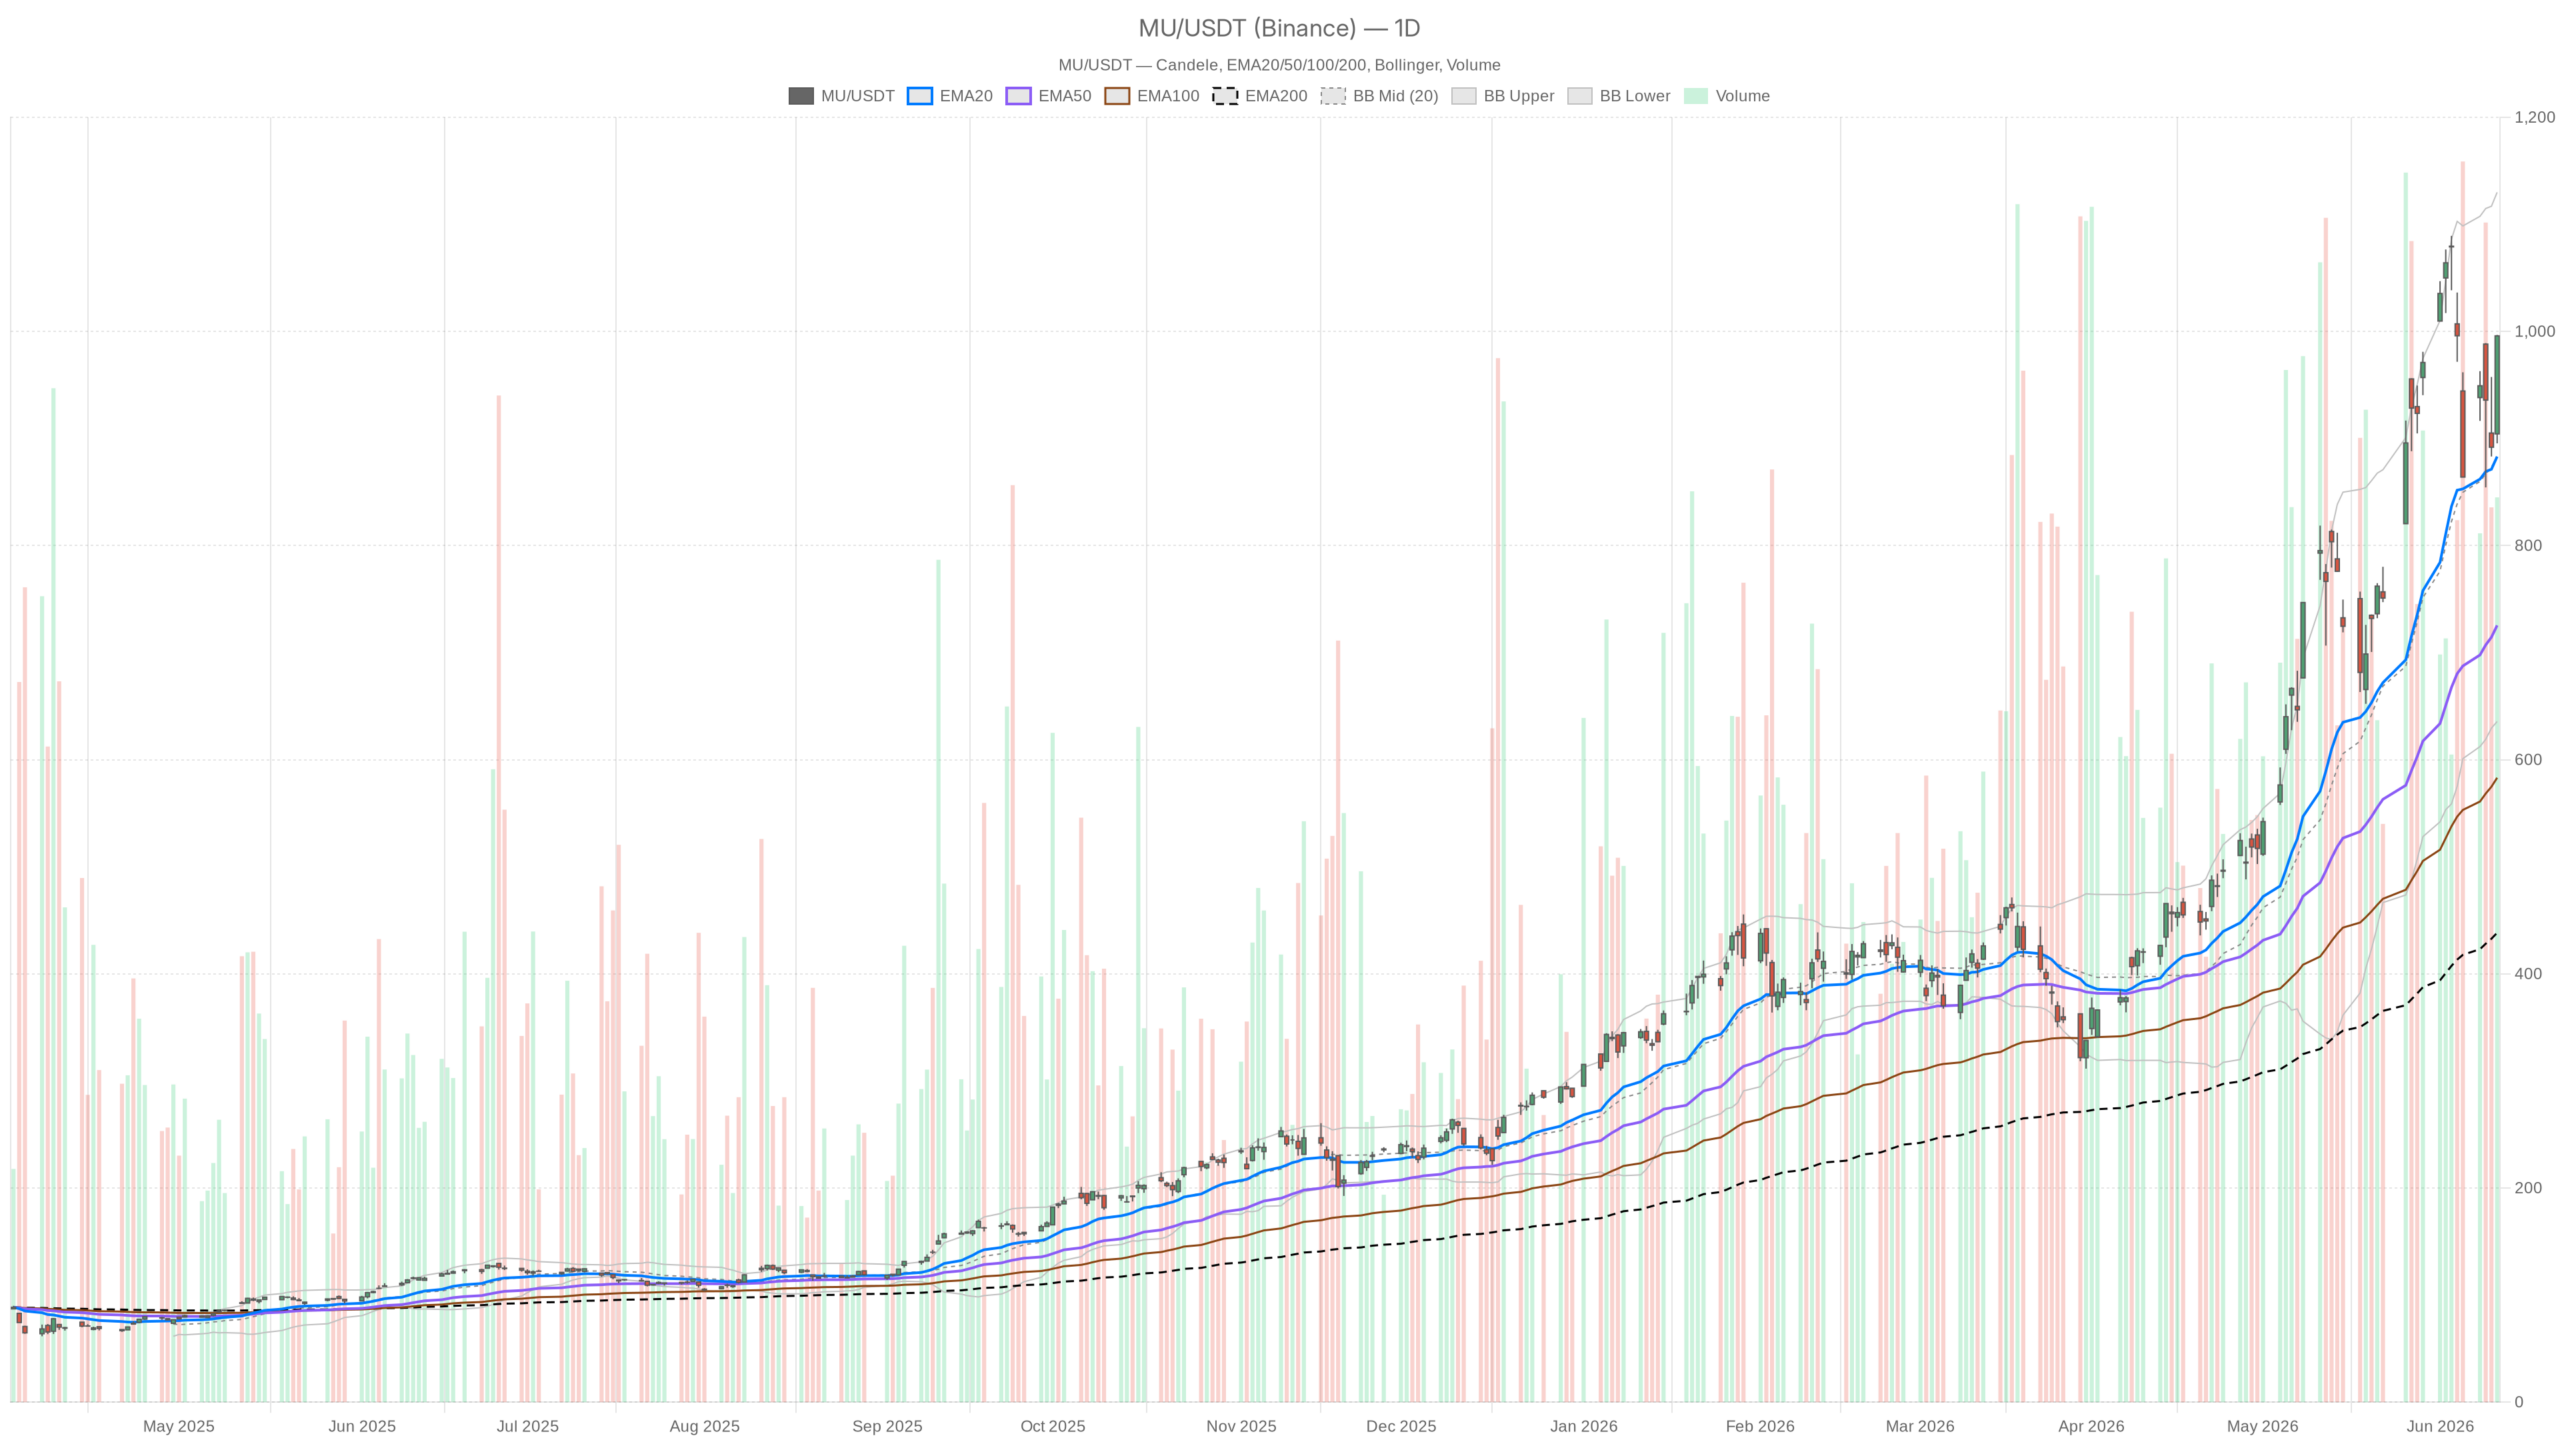
Daily Chart Confirms Bullish Dominance for Micron Stock
EMA Structure and Momentum Indicators
The daily regime is classified as bullish, and the EMA stack confirms it without ambiguity. Price trades well above the 20-day EMA at $883.18, comfortably above the 50-day at $725.49, and dramatically above the 200-day at $438.40. Each layer of the moving average ladder is fanned outward. This is a textbook sign of sustained, broad-based trend strength.
This is not a recent recovery bounce. It reflects months of institutional accumulation. Micron Stock has become one of the premier AI infrastructure plays in the market.
Meanwhile, the daily RSI at 62.11 sits in healthy bullish territory without yet signalling exhaustion. MU still has room to extend before reaching overbought conditions. However, the MACD picture introduces a notable wrinkle. The MACD line at 86.50 has crossed below the signal line at 98.04, producing a negative histogram of -11.54.
This divergence does not reverse the trend. It does, however, suggest that upside momentum on the daily timeframe is moderating. Bulls should note the difference between a strong trend and a strengthening one.
Bollinger Bands, Volatility, and Pivot Levels
The Bollinger Bands reinforce the same message. With the upper band at $1,129.97 and the mid-band at $882.85, price is pressing into the upper half of the range. There is still meaningful room before hitting the upper band. The trend has not stretched into an obvious exhaustion zone.
The ATR at $86.28 is substantial. This confirms that Micron Stock remains a high-volatility instrument. Traders should size positions accordingly.
Daily pivot analysis places the pivot point at $962.71, with R1 at $1,029.93 and S1 at $928.66. The close above the pivot signals near-term bullish intent. Notably, R1 coincides closely with the $1,000 round-number resistance. The $1,000–$1,030 zone is now the immediate battlefield for bulls and bears alike.
Short-Term Timeframes Signal Caution for MU
Hourly and 15-Minute Warning Signs
Shifting to the hourly chart, the picture becomes more nuanced. The H1 regime is classified as neutral. Price closed at $995.65, above both the 20-hour EMA at $933.88 and the 50-hour at $939.26. These are individually bullish signals. Yet the Bollinger Band structure tells a different story.
The upper band on the H1 sits at $977.93, and the current close is punching through it. This kind of extended positioning often precedes short-term consolidation. A pullback toward the mid-band at $918.43 would not be unusual. The H1 RSI at 65.03 is elevated but not extreme. Still, momentum is clearly stretched on this timeframe.
In contrast, the H1 MACD is constructive. The MACD line at 4.70 has crossed above the signal line at -7.30, generating a positive histogram of 12.00. That cross suggests intraday momentum is recovering and aligning with the broader bullish bias. Overall, the hourly timeframe leans neutral-to-bullish but flags the risk of near-term mean reversion.
At the 15-minute level, the picture sharpens further. The RSI at 81.24 is firmly in overbought territory. MU is extended on a short-term basis. The 15m MACD histogram at 5.75 remains positive but is showing signs of plateauing. For momentum traders, this is not an ideal entry window. The short-term chart favours waiting for a pullback before adding exposure.
Fundamental Backdrop and Macro Risks
On the fundamental side, the backdrop for Micron Stock remains strongly supportive. Cantor Fitzgerald raised its price target to $1,500 from $700 on June 8. This bold revision reflects growing conviction around HBM4 memory demand tied to AI infrastructure buildout.
In addition, MU has reportedly crossed the $1 trillion market cap threshold. Hedge fund positioning, including Ken Griffin’s portfolio, continues to treat it as a core AI holding. Meanwhile, a memory chip shortage narrative is providing a structural demand tailwind. This goes beyond typical semiconductor cycle dynamics.
At the same time, the news flow is not entirely one-directional. Reports of a risk-off mood on June 10 pressured AI hardware names including Micron. The drivers included Super Micro’s stock sale, hot inflation data, and rising geopolitical tensions in the Gulf. The looming SpaceX IPO and concerns around high tech valuations are adding macro friction. These are not trend-reversing catalysts. But they matter for near-term volatility.
Bullish and Bearish Scenarios for Micron Stock
The bullish scenario is straightforward. If MU clears and holds above $1,000, the path toward R1 at $1,029.93 opens up. Analyst price targets in the $1,500 range would suddenly look less speculative. Continued AI capex from hyperscalers and a structural memory shortage would sustain the fundamental case. Any hourly mean reversion toward the $960–$980 zone would likely attract buyers rather than signal trend failure.
On the other hand, the bearish scenario hinges on macro and valuation risks. If the broader tech sell-off deepens, MU could retrace toward daily S1 at $928.66 or even test the 20-day EMA around $883. Potential triggers include the SpaceX IPO liquidity drain and inflation-driven rate fears.
Therefore, a daily close below the pivot at $962.71 would be an early warning sign. It would suggest the near-term bullish structure is breaking down. The MACD divergence on the daily chart would amplify that signal.
Conclusion: Respect the Trend, Manage the Risk
In summary, the dominant bias for Micron Stock remains bullish on the daily timeframe. It is supported by a clean EMA structure, an RSI with headroom, and a powerful AI memory demand narrative. However, the hourly chart is stretched. On the 15-minute timeframe, conditions are overbought. And the macro backdrop carries real friction.
Traders and investors should respect the trend — but also respect the near-term extension risk. Chasing MU at current levels requires clear risk management. Patience for a pullback toward key support zones would offer a materially better risk-reward entry. This remains one of the market’s defining momentum stories.
0
0
 Manage all your crypto, NFT and DeFi from one place
Securely connect the portfolio you’re using to start.