ZEC Crosses $500, Hitting Multi-Year Highs, Trader Earns Millions

0
0
While the broader crypto market continues to recover from this week’s pullback, Zcash ZEC $518.4 24h volatility: 19.5% Market cap: $8.49 B Vol. 24h: $1.80 B has stolen the spotlight by crossing the key psychological $500 level. The privacy-focused cryptocurrency is currently trading near $514, up around 20% in the past 24 hours.
This marks the first time ZEC has touched these levels since January 2018. This comes after a consistent uptrend by the cryptocurrency throughout October, despite global market volatility.
Over the last 30 days, ZEC has surged more than 250%, adding around $5.7 billion in market capitalization. With its latest rally, its total market value now stands at $8.46 billion, entering the list of the world’s top 20 cryptocurrencies by market cap.
According to on-chain data from Lookonchain, an anonymous trader created a new wallet earlier this week and went all-in on ZEC. The trader’s long position of 32,000 ZEC, valued at around $16.3 million, now sits on an unrealized profit of around $2.7 million.
Someone created a new wallet (0x96ea) 3 days ago and FOMOed long on $ZEC — now sitting on $2.7M in unrealized profit.
Position: 32,000 $ZEC($16.3M).
Liquidation price: $373.13https://t.co/W0anYjkwVb pic.twitter.com/d0HE4CgvcJ— Lookonchain (@lookonchain) November 6, 2025
Notably, the ZEC price surge coincides with massive activity in Zcash’s PoW system. The network’s hashrate recently surged to a historical peak of 12.53 GS/s. Analysts believe that the growing network adoption could boost ZEC price, making it one of the best crypto to buy.
ZEC Price Outlook: Extended Rally or Exhaustion Ahead?
On the daily chart, ZEC is currently around the upper Bollinger Band. This is a sign of strong bullish momentum but also a potential warning of short-term overheating.
In case of a price drop, immediate support is seen near $450, followed by stronger support around the mid band (20-day SMA) at $390–$400.
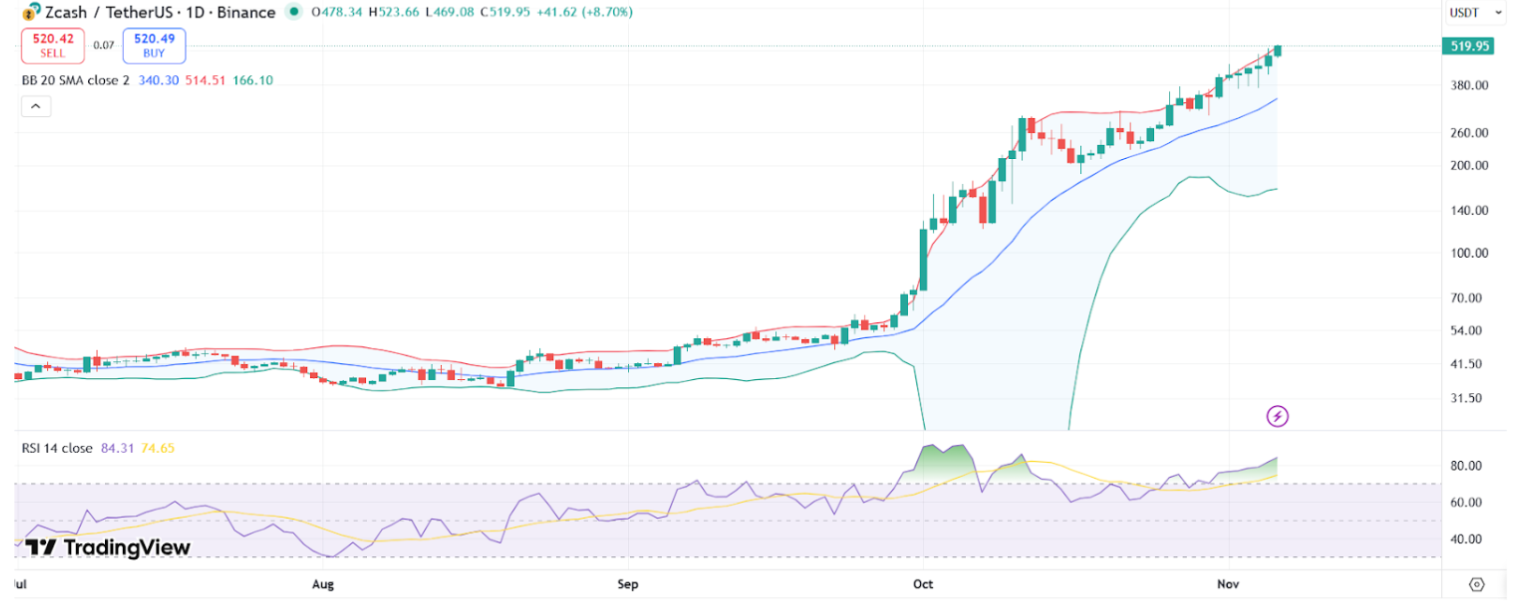
ZEC price chart with RSI and Bollinger Bands | Source: TradingView
Meanwhile, the RSI has climbed above 70, typically signaling overbought conditions. However, in case bullish demand continues, analysts expect the next resistance zone around $550–$580, with a potential breakout leading to $620 or higher.
🚀 $ZEC has surpassed our $500 price target — the new target is $800 by year-end! 🔥
Read more 👇https://t.co/Z1L7HABg77
— CoinCodex (@CoinCodex) November 6, 2025
Market analytics firm CoinCodex noted on X that ZEC has surpassed its initial $500 target and raised its year-end projection to $800.
$ZEC buy was one of the best calls on this page in a while, more than 20x gains
if you bought with me consider taking profits and rotating to other good coins
NEVER MARRY YOUR BAG, NEVER. pic.twitter.com/O6emLWgcMU
— $0uL (@spetsnaz_3) November 6, 2025
While ZEC’s outlook remains bullish, many agree that the recent surge might soon invite a round of profit-taking before the next leg up. Popular analyst Soul advised investors to secure profits if they entered early, adding, “Never marry your bag.”
The post ZEC Crosses $500, Hitting Multi-Year Highs, Trader Earns Millions appeared first on Coinspeaker.
0
0

 Manage all your crypto, NFT and DeFi from one place
Securely connect the portfolio you’re using to start.


0
0
