Why Is The Crypto Market Down Today?

0
0

The crypto market (TOTAL) is flashing red on March 23, extending a streak of selling that has erased much of the gains built earlier this month. Multiple assets are pressing into support levels that have not been tested since February. What the charts show across Bitcoin (BTC) and Sky (SKY) helps explain the pressure playing out today.
In the news today:-
- Asian markets fell sharply on Monday as the US-Iran war’s fourth week brought a Strait of Hormuz ultimatum, rattling energy and inflation outlooks. South Korea’s Kospi dropped 4.71%, Japan’s Nikkei shed 3.37%, extending its March loss to over 13%, and Australia’s ASX fell 1.5%.
- NYSE Arca and NYSE American filed SEC rule changes to remove position and exercise limits on options tied to spot Bitcoin and Ether exchange-traded funds, covering 11 crypto products. The SEC waived the standard 30-day waiting period, making the changes effective immediately upon filing.
The Crypto Market Faces Losses
The total crypto market cap sits at $2.32 trillion on the daily chart, up a marginal 0.28% with a high of $2.34 trillion and a low of $2.3 trillion. Price has tested the $2.32 trillion horizontal support level on consecutive sessions after a sharp five-day decline from $2.5 trillion. The annotated candle shows a $23.09 billion loss of 1.02%.
The market cap closing at $2.32 trillion for a second session without a recovery close above $2.37 trillion confirms sellers are in control. That $2.37 trillion level, which held as support through mid-March, has now flipped to resistance. Continued failure below $2.37 trillion keeps the path open toward $2.25 trillion, the next horizontal floor visible on the chart.
Want more token insights like this? Sign up for Editor Harsh Notariya’s Daily Crypto Newsletter here.
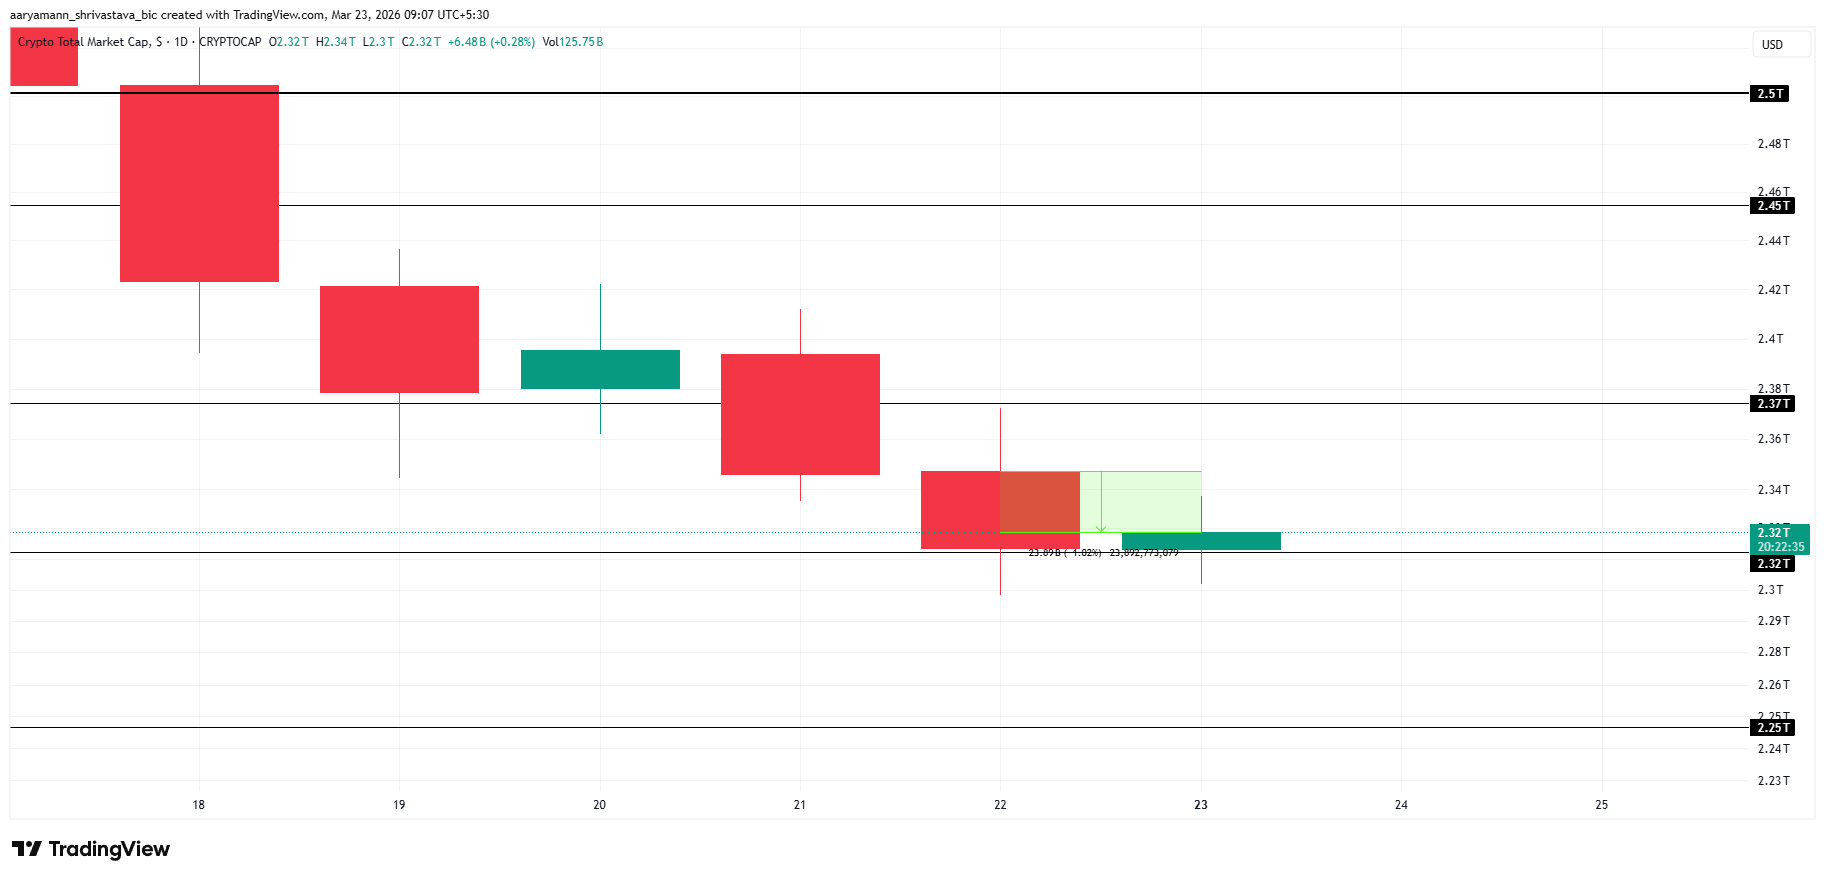 TOTAL Price Analysis. Source: TradingView
A daily close back above $2.37 trillion would invalidate the bearish structure and reopen the path toward $2.45 trillion. That level capped price on March 20 before the latest leg lower. Without a close above $2.37 trillion, the $2.32 trillion base remains the only visible structure between the current price and $2.25 trillion below.
Bitcoin Falls To 2-Week Low
Bitcoin is trading at $68,175 on the daily chart, up 0.46% with a high of $68,601 and a low of $67,452. Price has broken below the $68,865 support level and is trading beneath it for the first time since early March. The Money Flow Index reads 68.90, declining from a recent peak near 80 and signaling fading buying pressure.
Bitcoin closing below $68,865 after failing to hold $70,552 earlier this week confirms the bearish sequence. The Money Flow Index dropping from 80 toward 68.90 while price loses key horizontal support reinforces that momentum has shifted. The $65,776 level is now the primary target below, with $64,043 visible as a secondary floor if selling accelerates.
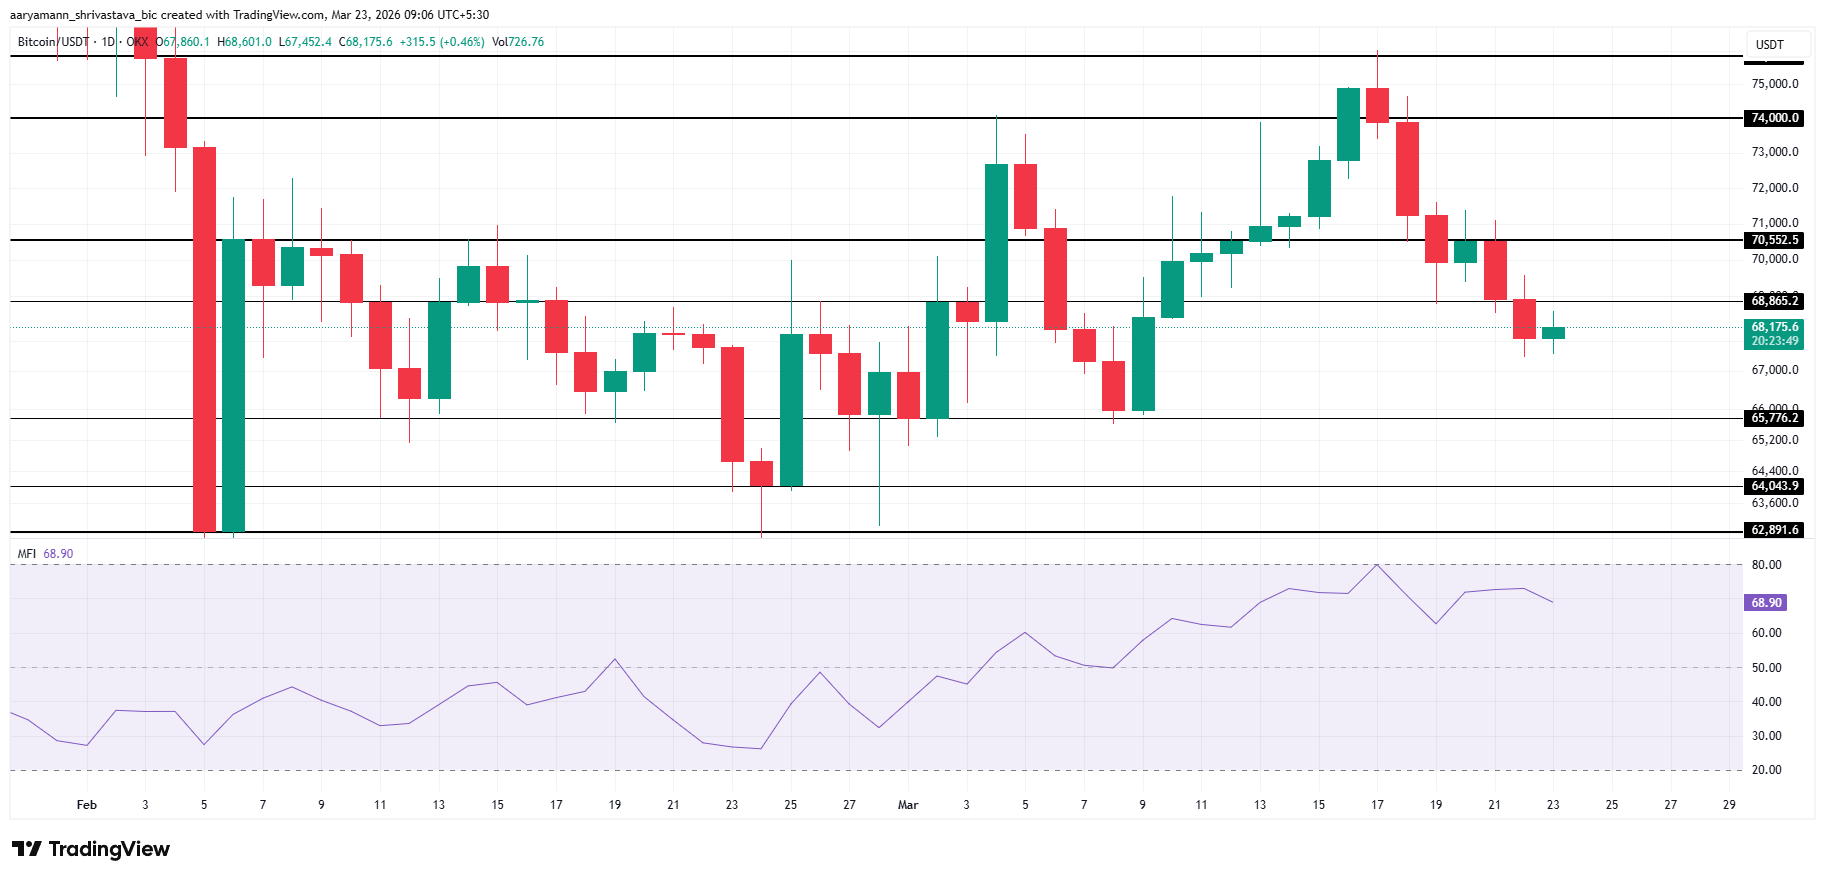 Bitcoin Price Analysis. Source: TradingView
A daily close back above $68,865 would neutralize the immediate bearish case and bring $70,552 back into focus as the next resistance. Reclaiming $70,552 on a close would be required to shift the structure back in favor of buyers. Until that happens, $68,865 acts as overhead resistance, and $65,776 remains the downside target.
Sky Loses Crucial Support
Skycoin (SKY) is trading at $0.0685 on the daily chart, down 3.25% with a high of $0.0714 and a low of $0.068. Price has broken below the 0.618 Fibonacci level at $0.0704 and the 50-day EMA (exponential moving average) at $0.0701, both of which held as support through the prior week. The annotated session shows a loss of 9.08%, marking 684 units of selling.
SKY trading below both the 0.618 Fibonacci level at $0.0704 confirms a bearish structure. The 0.382 Fibonacci level at $0.0668 is the next support below the current price. A close below $0.0668 would expose the 0.236 level at $0.0646, which sits just above the base level at $0.0611.
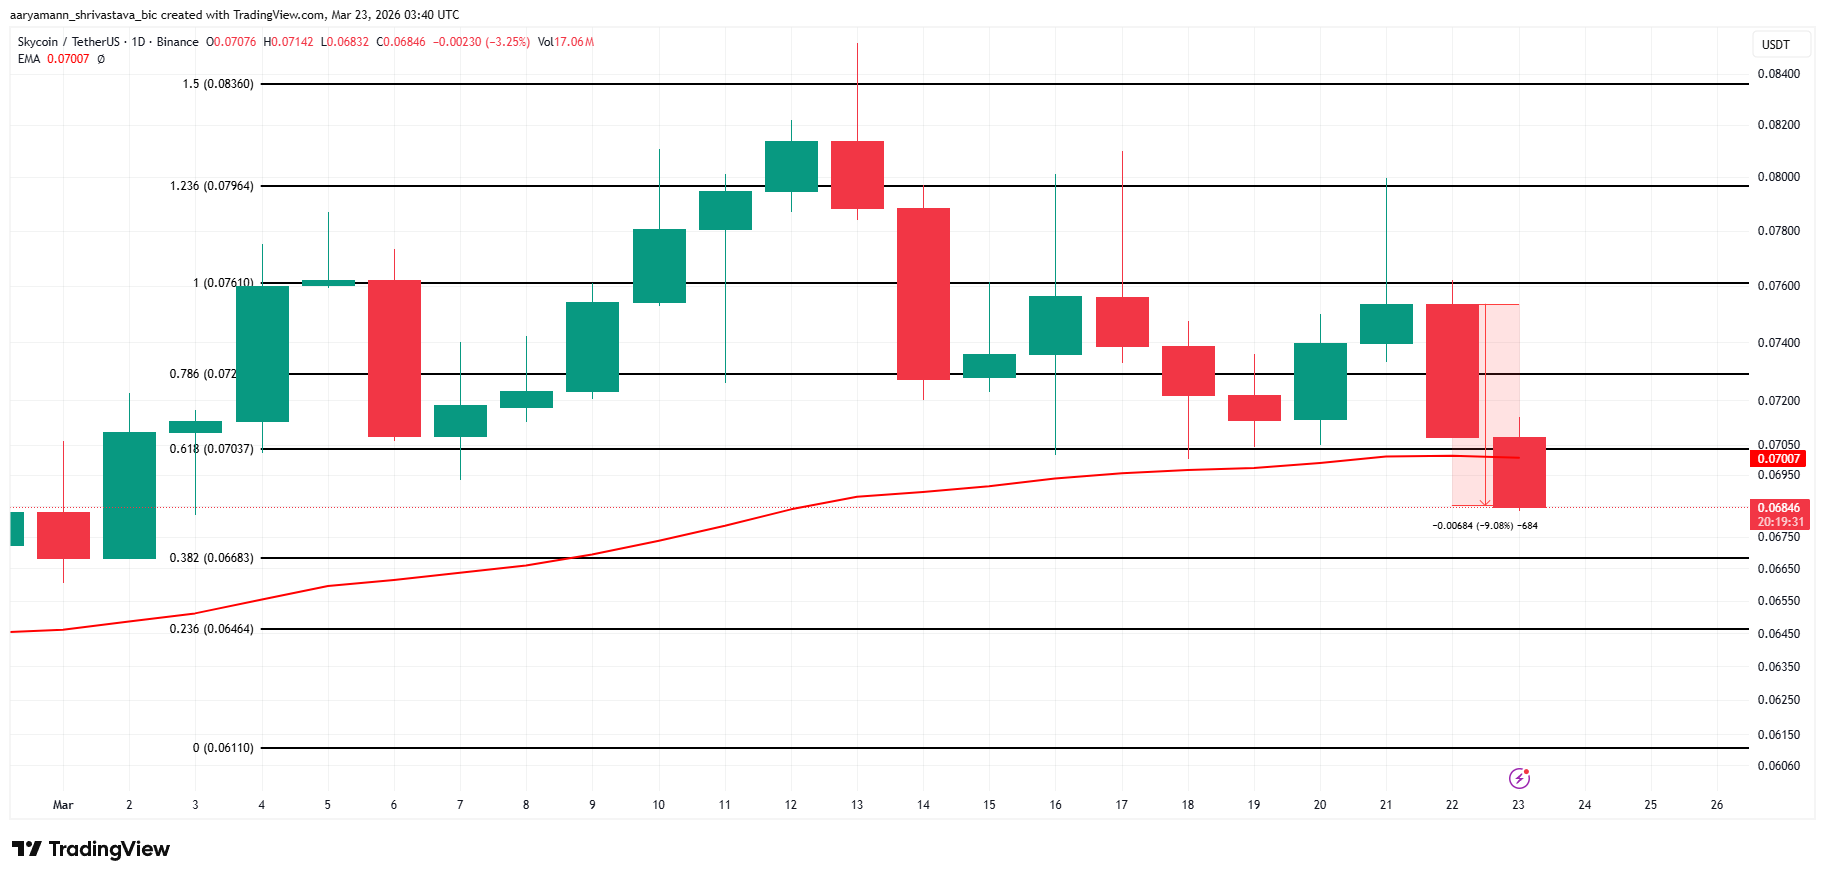 SKY Price Analysis. Source: TradingView
A recovery above the EMA and a daily close back above $0.0704 would invalidate the bearish thesis. That reclaim would bring the 0.786 Fibonacci level at $0.0720 back into focus as the next resistance overhead. Without a close above $0.0704, the path of least resistance points toward $0.0668 and below.
0
0


 Manage all your crypto, NFT and DeFi from one place
Securely connect the portfolio you’re using to start.


0
0

0
0

0
0