Shiba Inu Price Forms Symmetrical Triangle Amid 77M SHIB Losses

1
0

Shiba Inu (SHIB) price has decreased in the past 24 hours, mirroring the overall industry-wide downturn. At the moment, SHIB is trading at the $0.000012 support level. With the loss of 77 million SHIB, the coin has been making a symmetrical triangle pattern. Bitcoin (BTC) and Ethereum (ETH) are also under a price drop and significant liquidations.
Shiba Inu Price Forms Symmetrical Triangle as Market Corrects
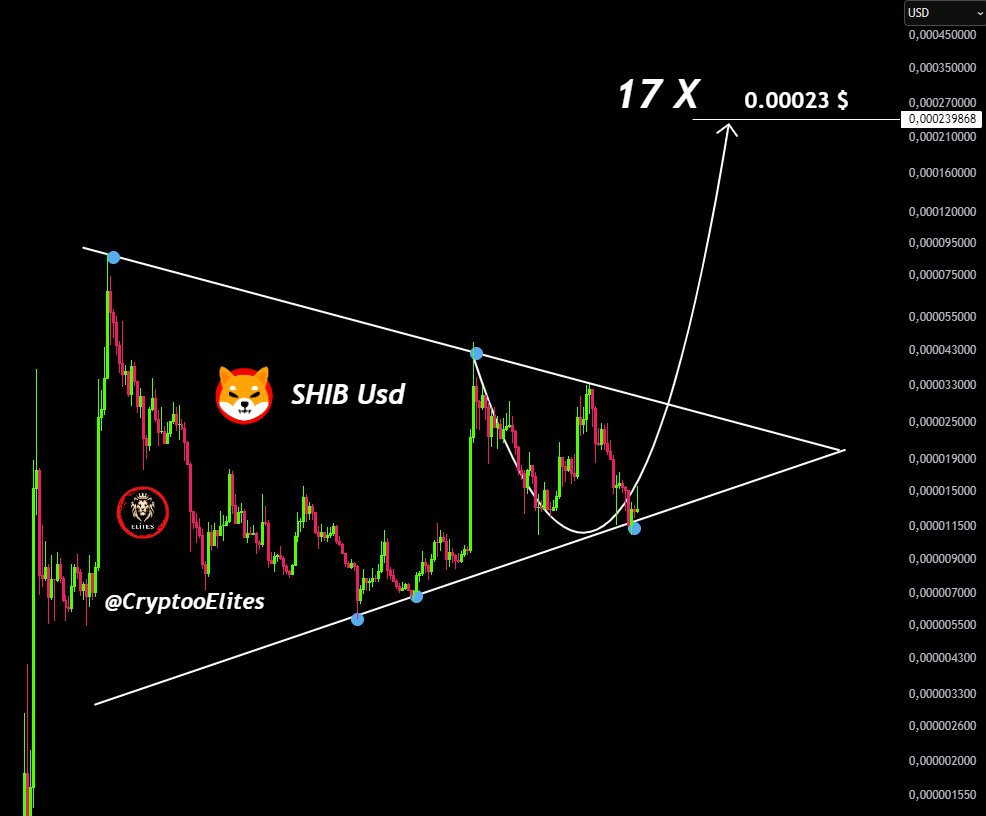
The crypto analyst highlights that the Shiba Inu price is currently in the middle of building a symmetrical triangle pattern, signifying a breakout. This technical formation indicates that cryptocurrency is in a consolidation period and has undergone some market corrections in recent times. The price of SHIB has been oscillating within a contracting range, suggesting a huge price movement is imminent.
SHIB is being shown by the analyst to be placed in a strong buy zone. As such, it was anticipated by analysts that its price could rise as high as 0. 0023 over the near term, a realization of some 17X.
SHIB Price: 77M SHIB Sold at Loss, Signaling Market Shift
The recent surge of the 30 day MVRV ratio above zero for SHIB seems to hint at increased demand from investors. Transitioning to this shift, and increased confidence in that fact has resulted in a quick price rebound. The MVRV ratio measures market prices and the price at which tokens were last moved, and becomes positive on crossing into positive territory, indicating positive sentiment.

Also on March 20, 77.64 million SHIB was sold as a cause of a loss, which means that the assets were taken away from weak hands and transferred to stronger ones. Ownership shift often results in price stability, and in the most favorable cases, the emergence of long-term growth, where more engaged token owners stack, creating a positive space for long-term price movement.

How Low Will SHIB Price Go?
The latest SHIB price stands at $0.00001280, showing a modest 3% decrease in the past 24 hours. The meme coin movement appears to be consolidating within a descending channel pattern, which is visible on the daily chart.
The SHIB is encountering strong resistance around $0.000013, with an immediate support level found at $0.00001280. This range has been pivotal, as the price has recently bounced off this support area multiple times.
If the Shiba Inu price prediction breaks below the $0.00001250 level, a deeper pullback toward the $0.000012 support could be expected. If the crypto sell market increases, the SHIB price could decrease to $0.00001
The Relative Strength Index (RSI) is 36.37 and below the neutral as this may suggest weakness The Moving Average Convergence Divergence (MACD) line is below the signal line so bearish momentum is likely in the near term.

If SHIB manages to break to the upside, the first level of resistance would be at $0.00001300, which has been a key price point. If the price surpasses this level, the next resistance could be at $0.00001350, followed by $0.00001400. A successful break above these levels would suggest a shift toward a more bullish trend.
The post Shiba Inu Price Forms Symmetrical Triangle Amid 77M SHIB Losses appeared first on CoinGape.
1
0


 Manage all your crypto, NFT and DeFi from one place
Securely connect the portfolio you’re using to start.

0
0


