Could Ethereum slip below $2,200 if crypto correction deepens?

0
0

Ethereum has dropped to the $2,300 region after briefly reclaiming $2,400 on Thursday.
The top altcoin has been facing pressure near $2,380, which aligns with a key technical resistance, closing the daily candle below this psychological level.
The key resistance level is stuck between the cost basis of two cohorts, wallets with a balance of 10K-100K ETH and 1K-10K ETH at $2,324 and $2,436.
Ethereum faces selling pressure around $2,400
Ethereum is down by 1.5% in the last 24 hours and is now trading below $2,400. The price rejection comes as whales are starting to book profits following Ether’s recent rally.
Whale wallets have shown signs of distribution after prices climbed above their cost basis on Monday, offloading just 60,000 ETH since then.
The massive movement often flows from investors who are looking to walk away after their holdings break even.
Meanwhile, wallets holding 100-1K and 1K-10K ETH over the past three days have eased their outflows since the start of the week.
A similar sentiment is seen in capital inflows into Ethereum futures, which have stalled over the past few days.
Data obtained from CoinGlass shows that Ethereum’s futures Open Interest (OI) has hovered around 14.2 million ETH since the price jump on Monday and has failed to expand further.
The seven-day moving average of the Taker Buy-Sell Ratio has also begun to decline, indicating that derivatives interest is slowing.
According to CryptoQuant, the Taker Buy-Sell Ratio measures the difference in buying and selling volumes of traders using market orders to purchase ETH perpetual futures contracts.
A decrease in this metric indicates that long orders are dominating, and a decrease indicates the opposite.
Despite that, US spot ETH exchange-traded funds (ETFs) have registered six consecutive days of net inflows after pulling in $17.7 million on Thursday, indicating institutional demand is returning but at a slow pace.
A combination of these metrics indicates that the current rise above $2,300 is not yet backed by robust demand.
Ethereum could slip below $2,200
The broader crypto market is facing a likely correction as Bitcoin and Ether are currently in the red.
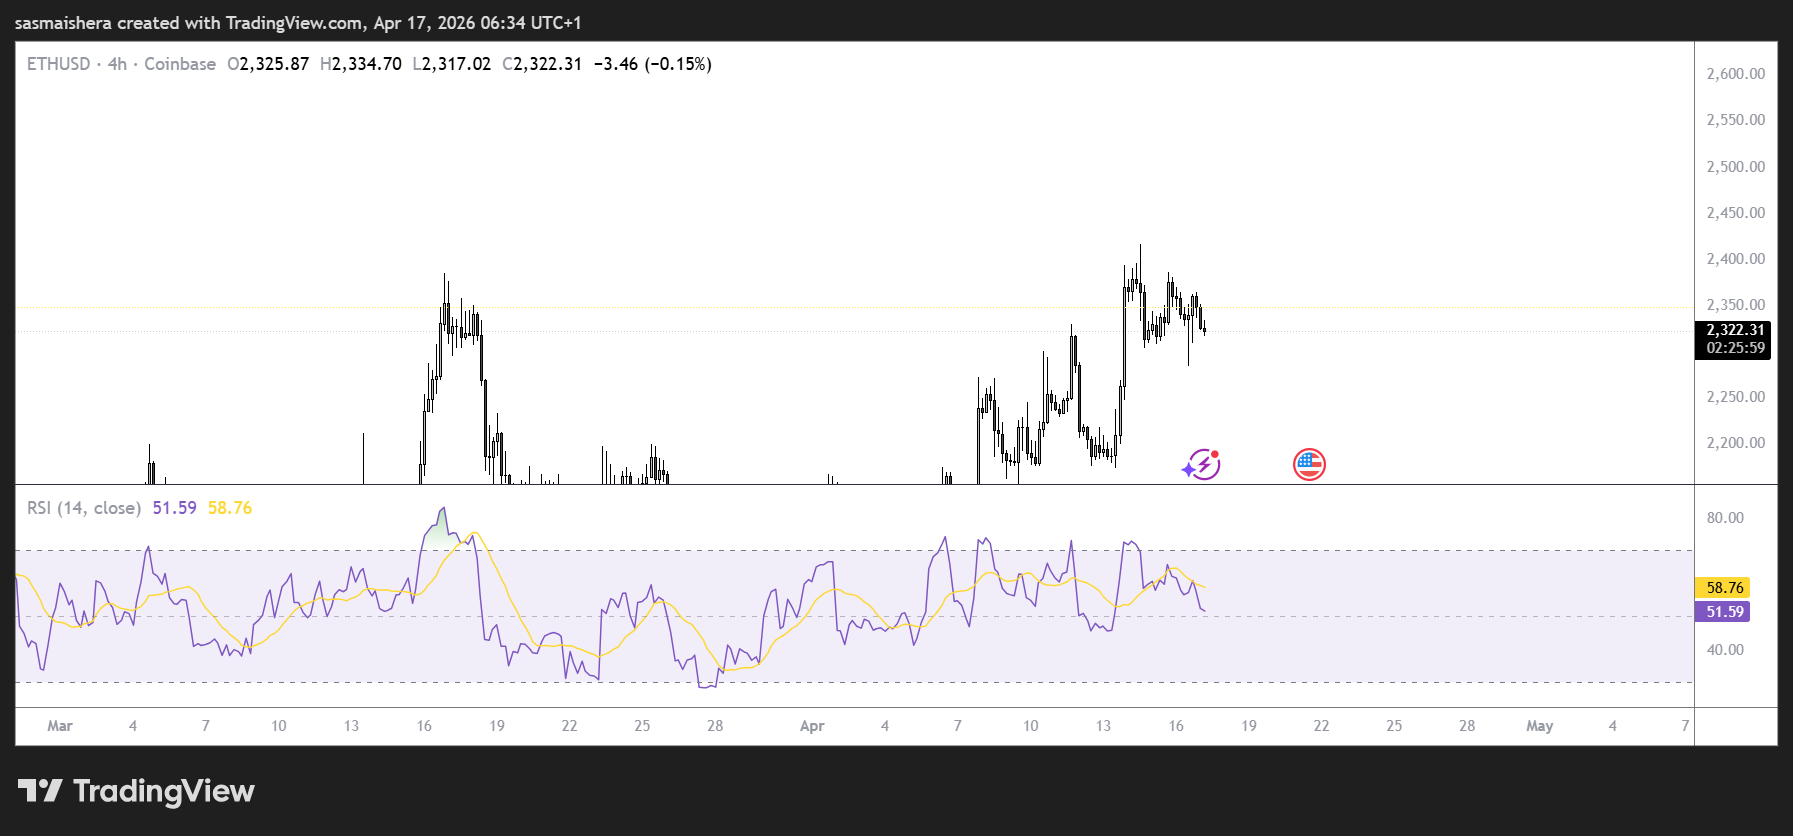
The ETH/USD 4-hour chart remains bullish and efficient despite the slight correction.
At press time, Ether is trading at $2,322, maintaining a constructive bullish tone as it holds above the 20- and 50-day Exponential Moving Averages (EMAs) at $2,214 and $2,190.
The declining bullish momentum is supported by the Relative Strength Index (RSI) hovering around 58.
The MACD lines are also approaching the neutral zone, indicating a fading bullish momentum.
Ethereum failed to rally higher after taking out the 100-day EMA at $2,376 on Thursday, with the level acting as immediate resistance.
However, a daily candle close above the 100-day EMA would open the way to $2,746 and then $3,411.
On the downside, if the correction persists, initial support emerges at the convergence of the 20 and 50-day EMAs and the horizontal level at $2,211.
A daily candle close below these levels would bring $2,107 and $1,909 into view before the more distant supports at $1,741 and $1,404.
The post Could Ethereum slip below $2,200 if crypto correction deepens? appeared first on Invezz
0
0

 Manage all your crypto, NFT and DeFi from one place
Securely connect the portfolio you’re using to start.

0
0

0
0

0
0

0
0