Why These Altcoins Are Trending Today — April 3
0
0

The crypto market experienced a downturn over the past 24 hours, with the total market capitalization dropping by $64 billion to settle at $2.64 trillion at press time.
Amid the pullback, certain altcoins have continued to attract attention. They include MANTRA (OM), VICE (VICE), and Qubic (QUBIC).
MANTRA (OM)
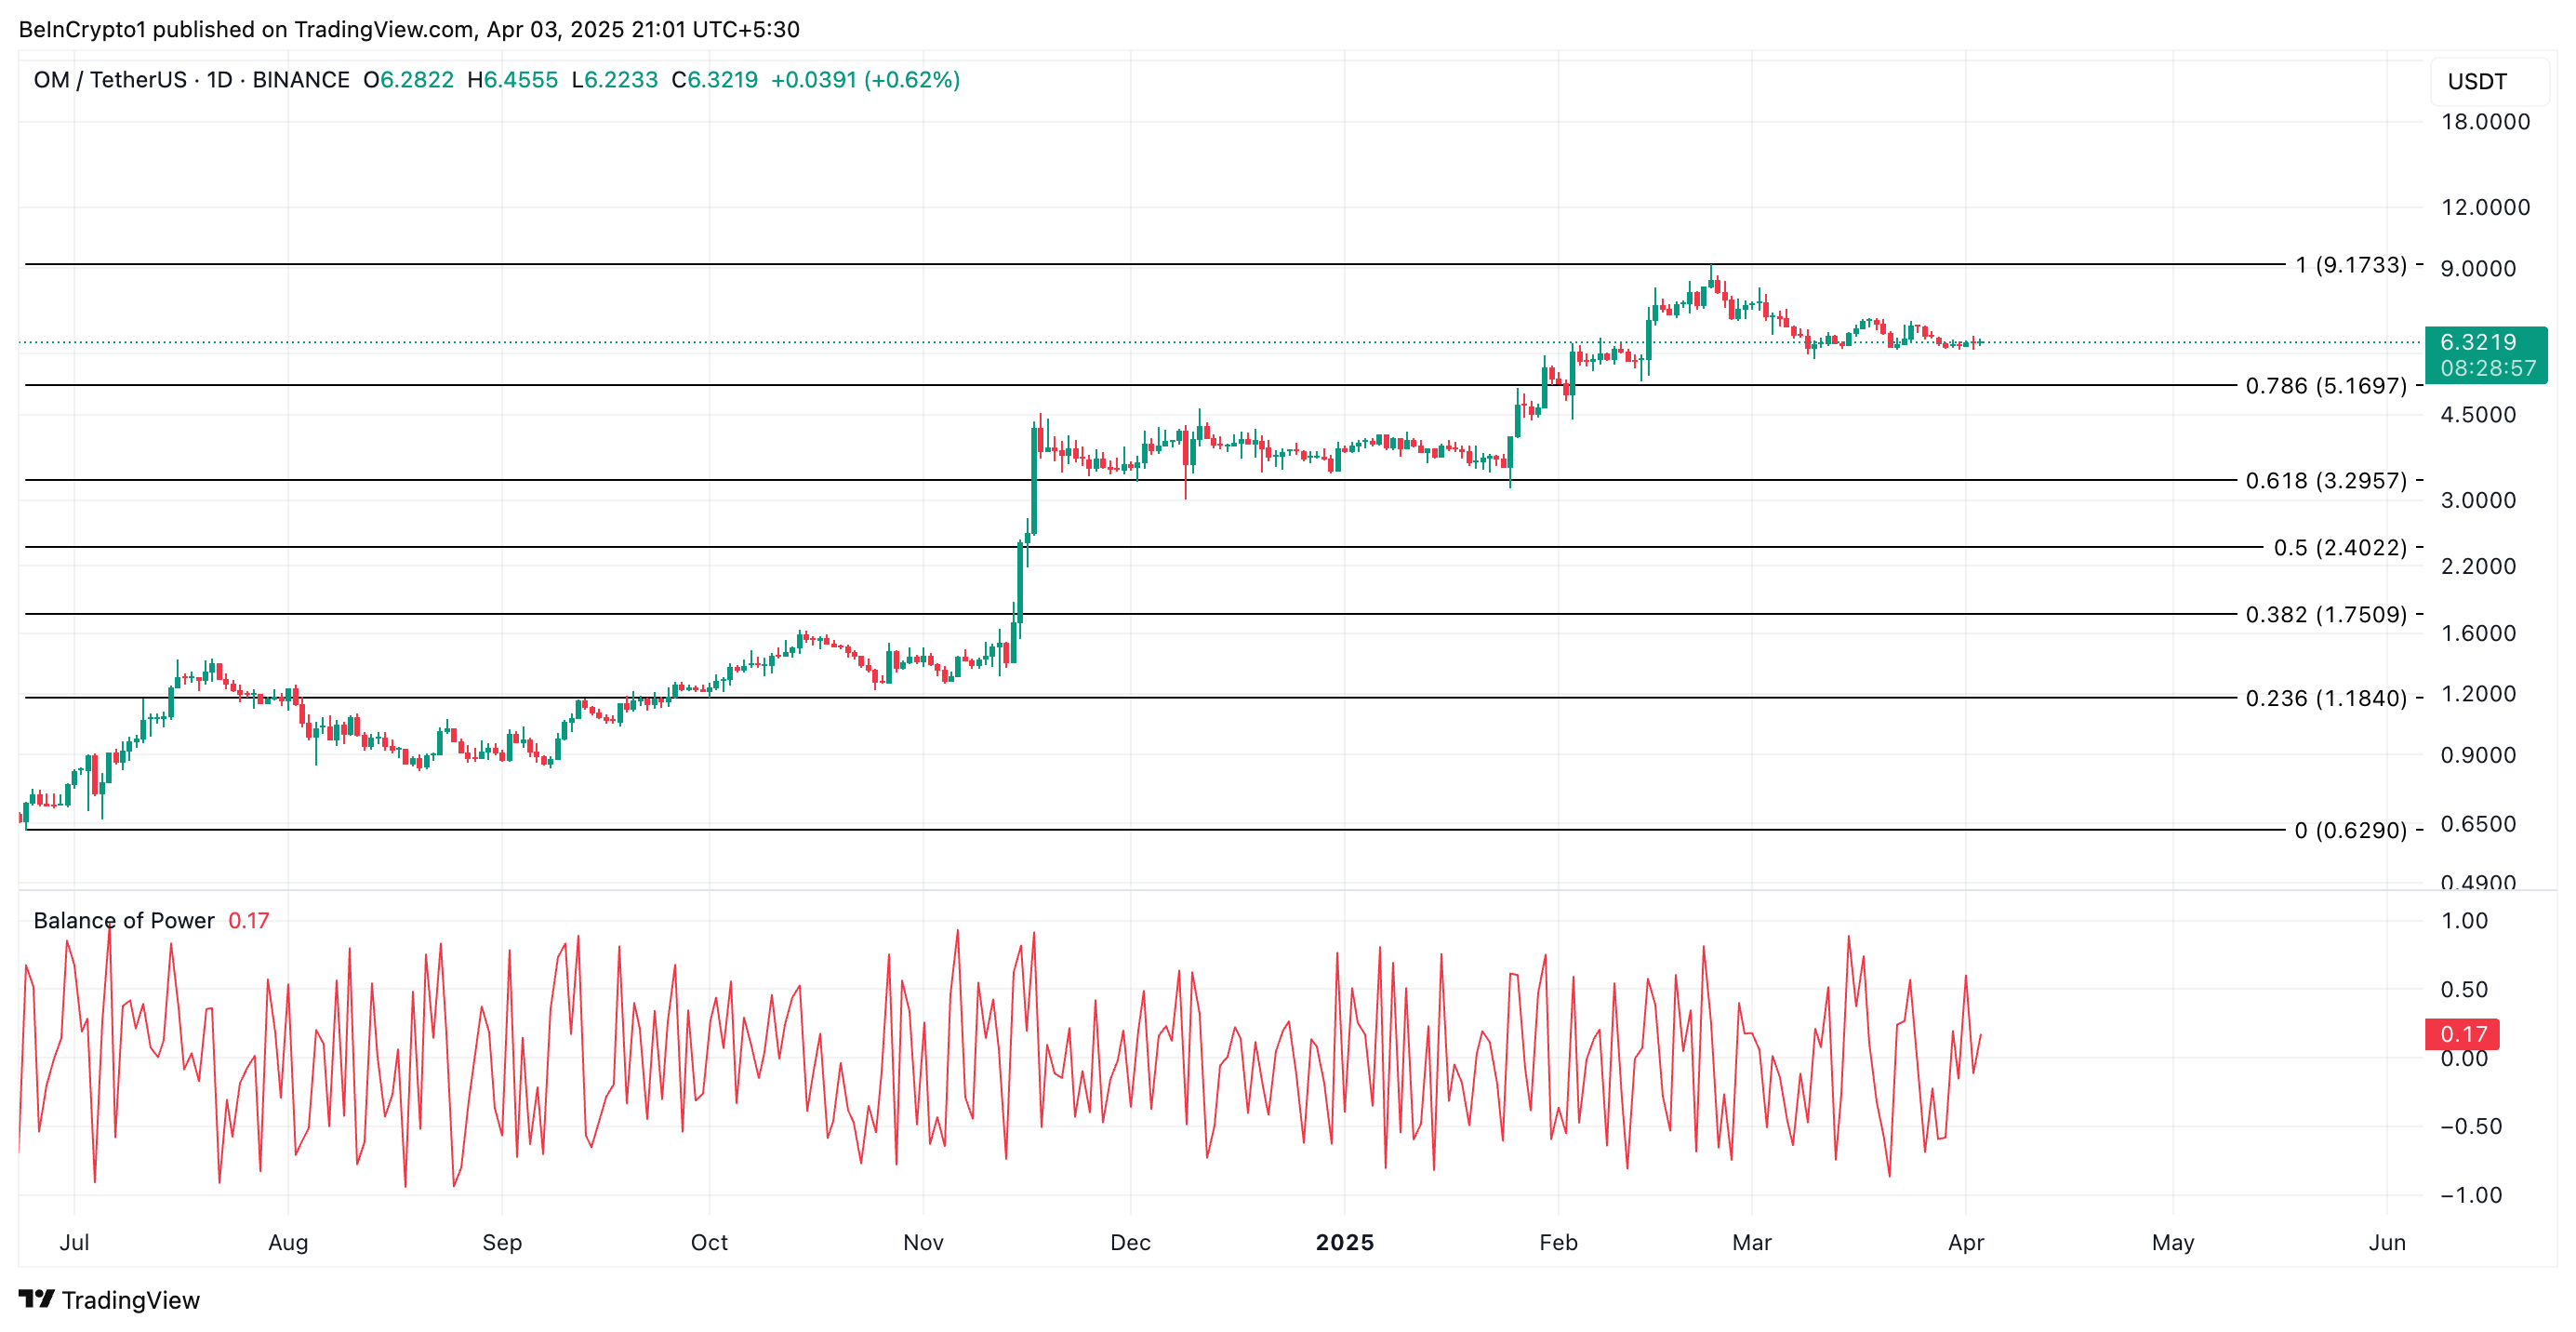
OM is one of today’s trending altcoins. It is down 1% over the past day and trades at $6.32 at the time of writing.
However, readings from OM’s daily chart suggest that the bullish bias toward it remains significant and that its price decline in the past 24 hours merely mirrors market trends.
For example, the token’s Balance of Power (BoP) is positive at press time, reflecting the buying pressure in the market. This currently stands at 0.17.
The BoP measures the strength of buying versus selling pressure in a given asset by analyzing price movements within a specific period. When its value is positive like this, buying pressure is dominant.
This suggests a sustained bullish momentum in the OM market as buyers exert more control over the price action. If this persists, OM could reverse its current downtrend and climb toward $9.17.
 OM Price Analysis. Source: TradingView
However, if OM maintains its decline, its price could fall to $5.16.
Qubic (QUBIC)
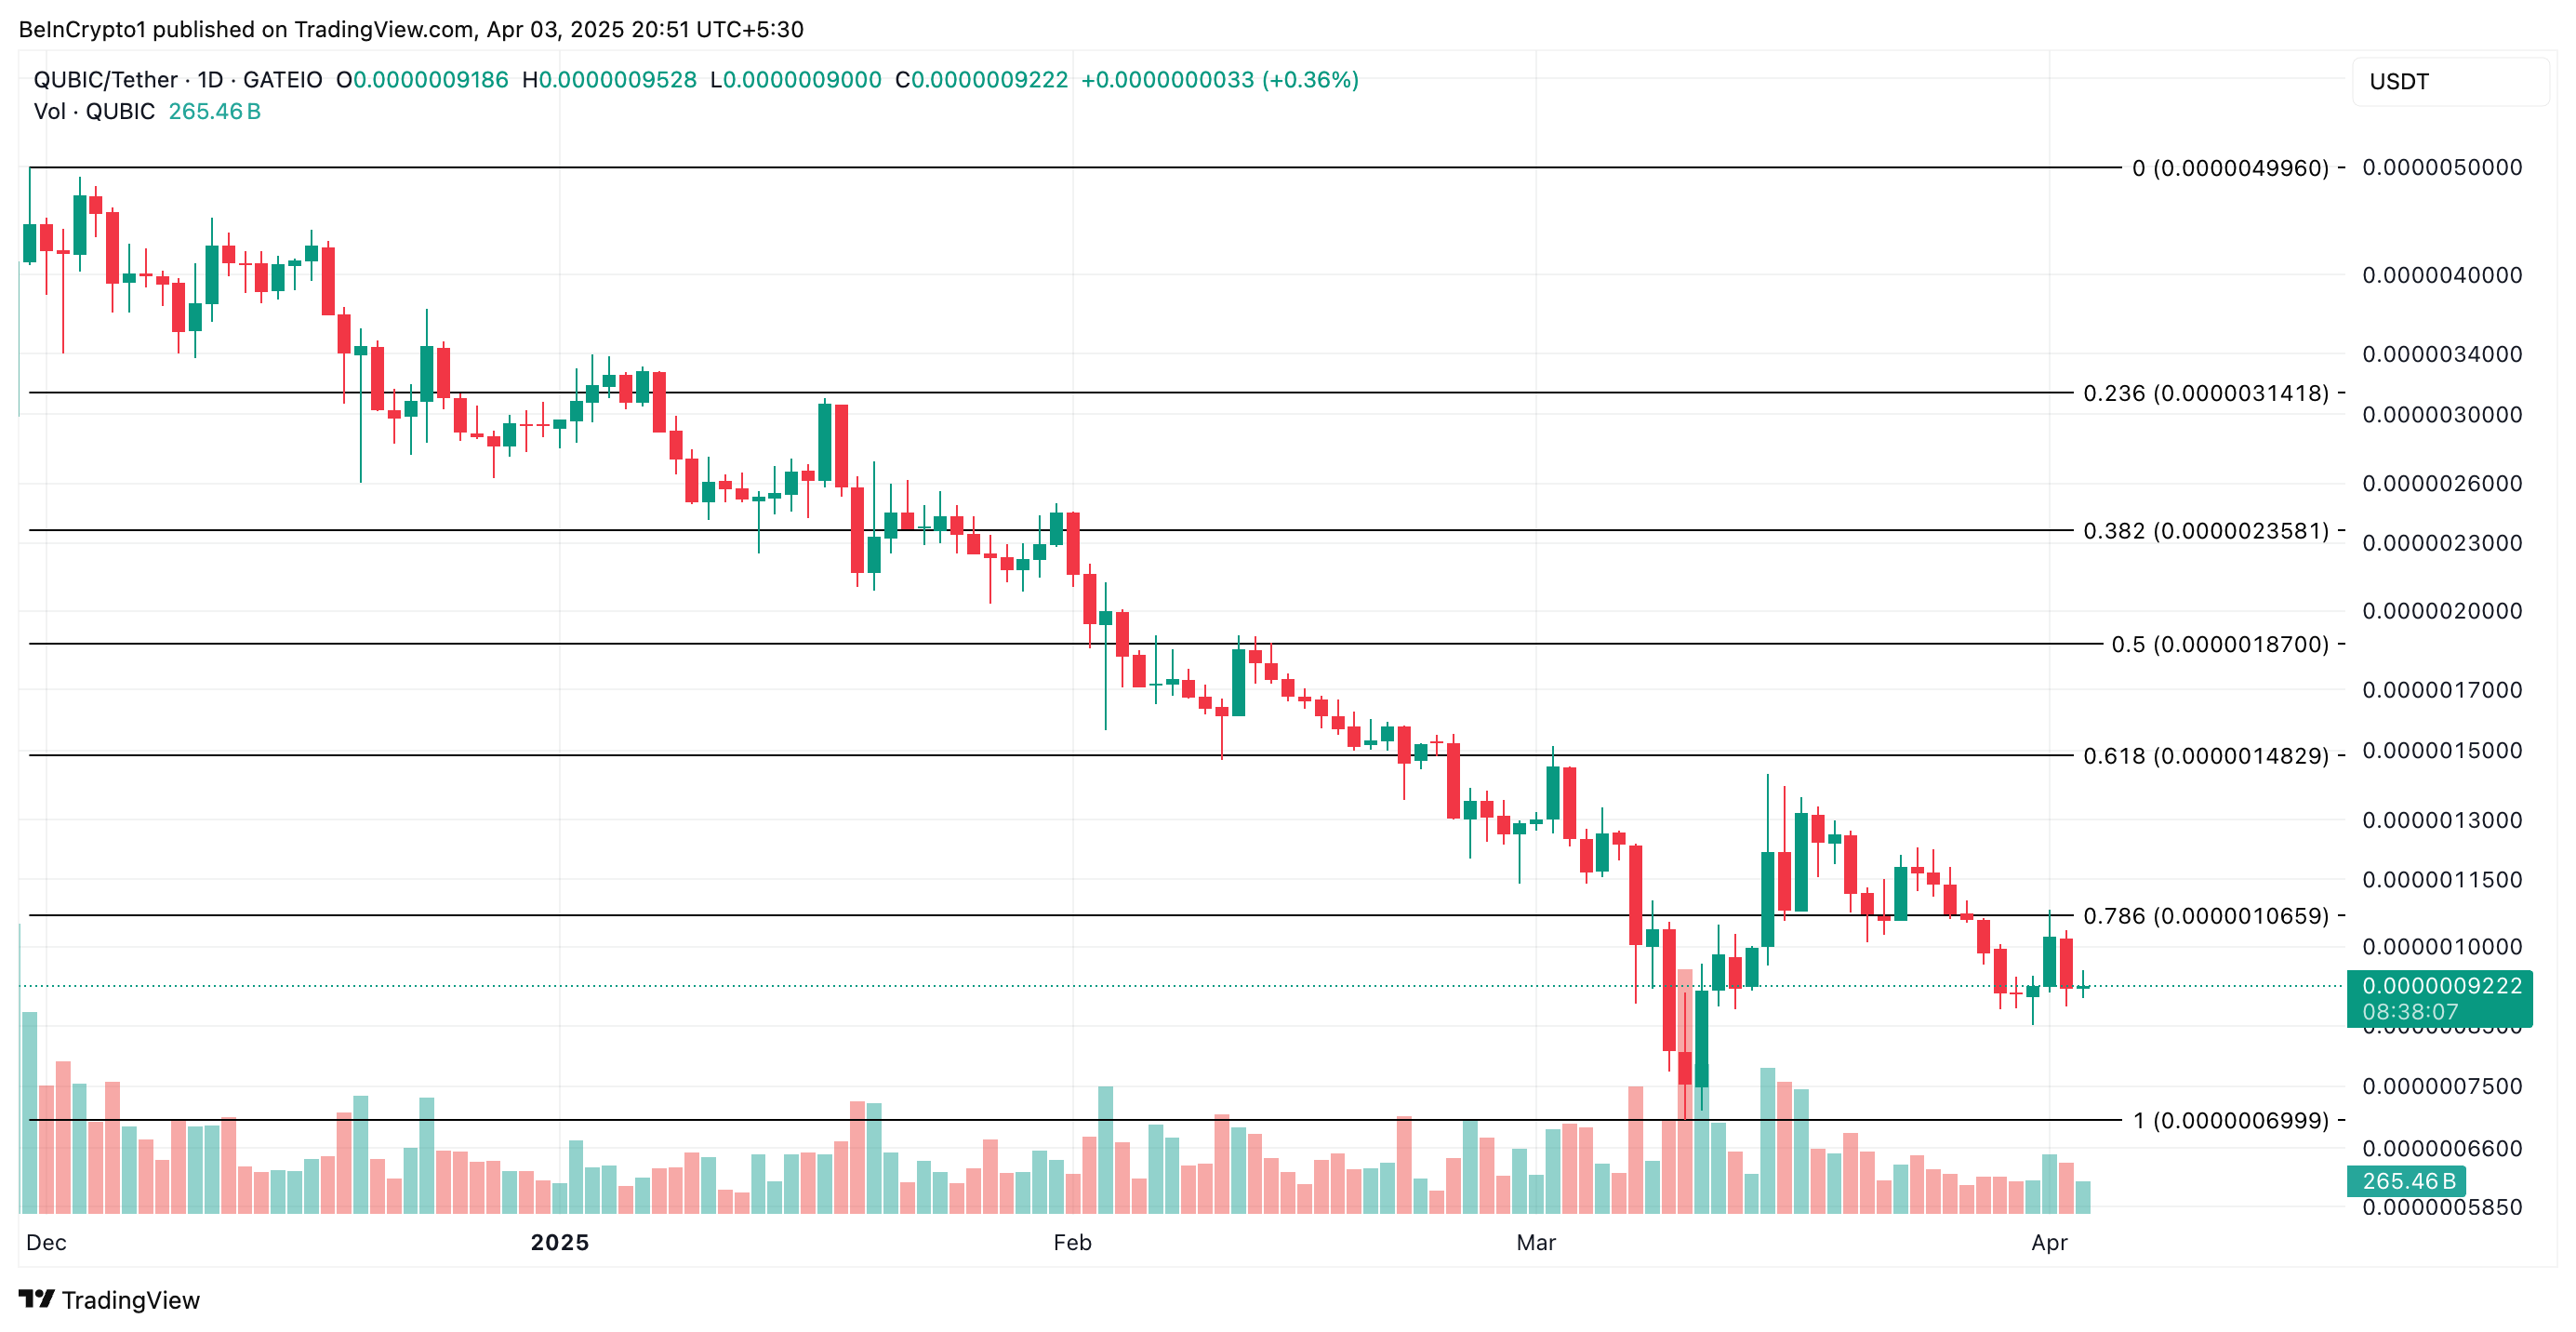
Layer-1 (L1) coin QUBIC is another altcoin trending today. It currently trades at $0.00000092, marking an 8% price drop over the past day.
During this period, its trading volume has spiked by 15%, totaling $2.29 million at press time. This confirms the surge in QUBIC selloffs among spot market participants.
When an asset’s price declines while trading volume surges, it signals strong selling pressure as more market participants are actively offloading the asset. This indicates a bearish trend, suggesting that QUBIC holders are exiting positions.
If this continues, the price decline will continue. In this case, QUBIC could trade at $0.000000699.
 QUBIC Price Analysis. Source: TradingView
On the other hand, if QUBIC witnesses a rebound, it could climb toward $0.00000106.
Toncoin (TON)
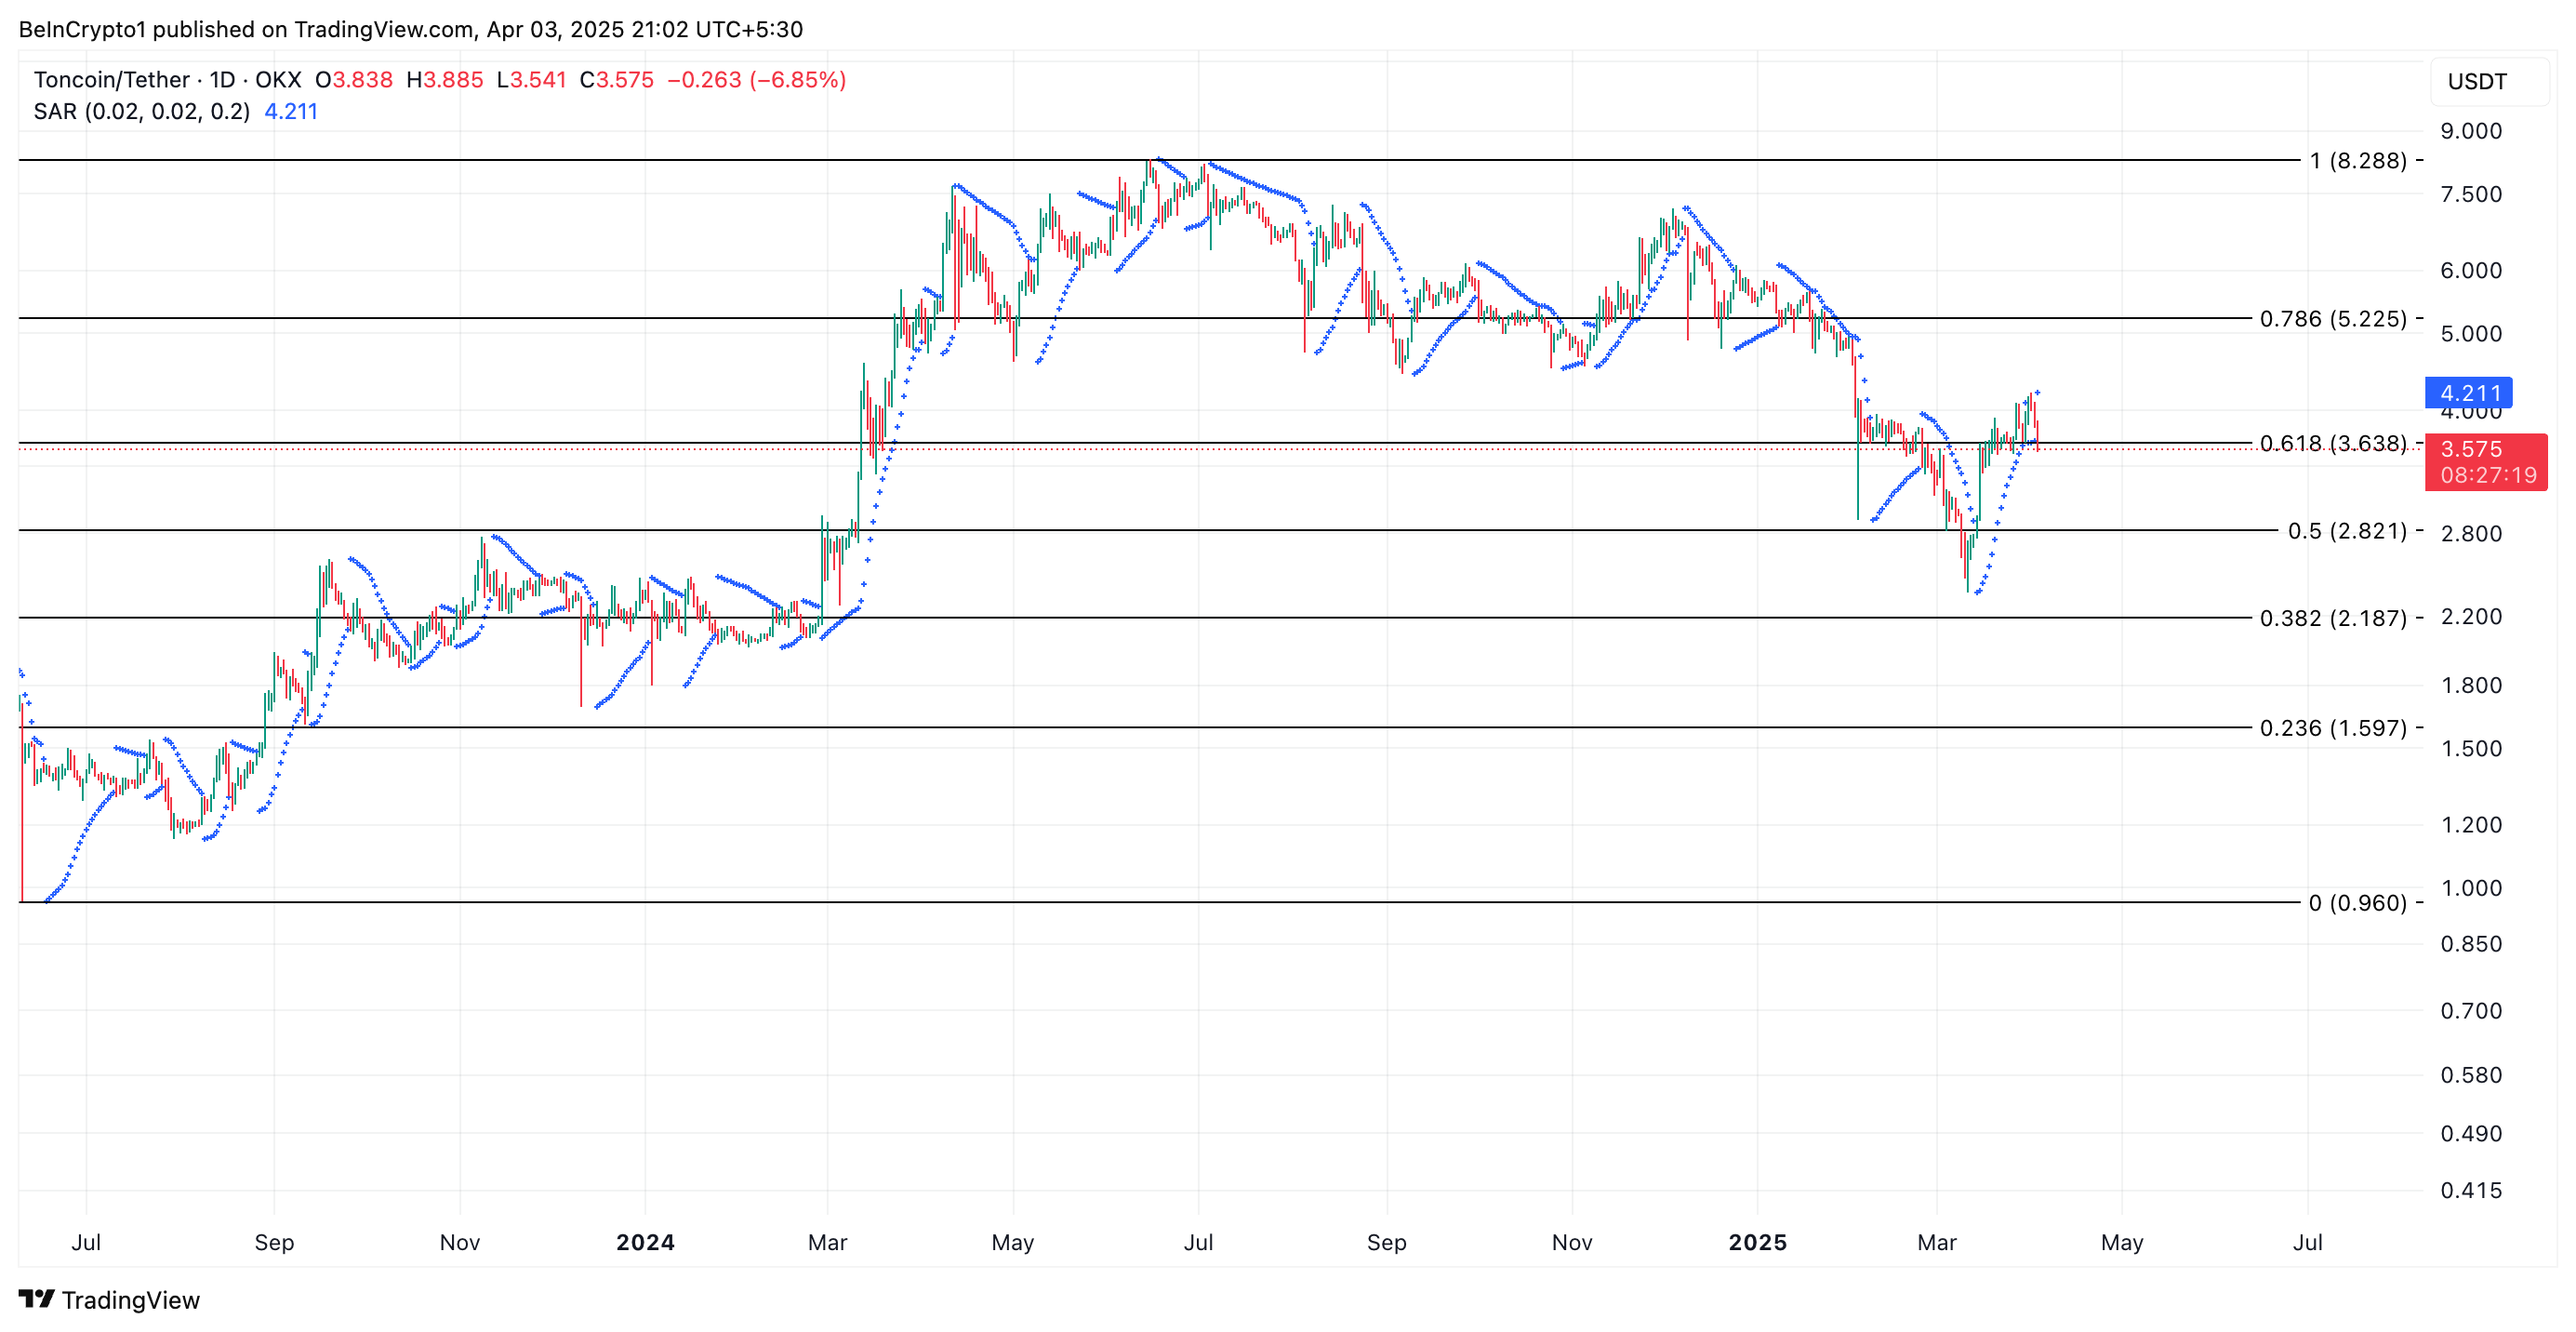
Telegram-linked TON is another asset that has caught traders’ attention today. As of this writing, it trades at $3.57, noting an 11% price dip.
On the daily chart, the dots that make up TON’s Parabolic Stop and Reverse (SAR) indicator lie above the price to form a dynamic resistance at $4.21.
This indicator identifies potential reversals by placing dots above or below price movements based on momentum. When the Parabolic SAR appears above the price, it signals a bearish trend, indicating strong downward momentum and suggesting a potential continuation of the decline unless a reversal occurs.
If TON’s decline continues, its price could drop to $2.82.
 TON Price Analysis. Source: TradingView
Converesly, if demand surges, and TON rallies, it could break above $3.63 to sell at $5.22.
0
0
 Manage all your crypto, NFT and DeFi from one place
Securely connect the portfolio you’re using to start.


