Strategy Stock stalls near $159 as bulls test 161–166

0
0

Strategy Stock (MSTR) is stabilizing near 159 after a volatile stretch. The daily trend remains neutral with a slight bearish tilt. Intraday momentum is improving; however, the tape still needs a clean reclaim of 161–166 to flip the bias.
Strategy Stock (MSTR) Daily Overview
Trend and Moving Averages
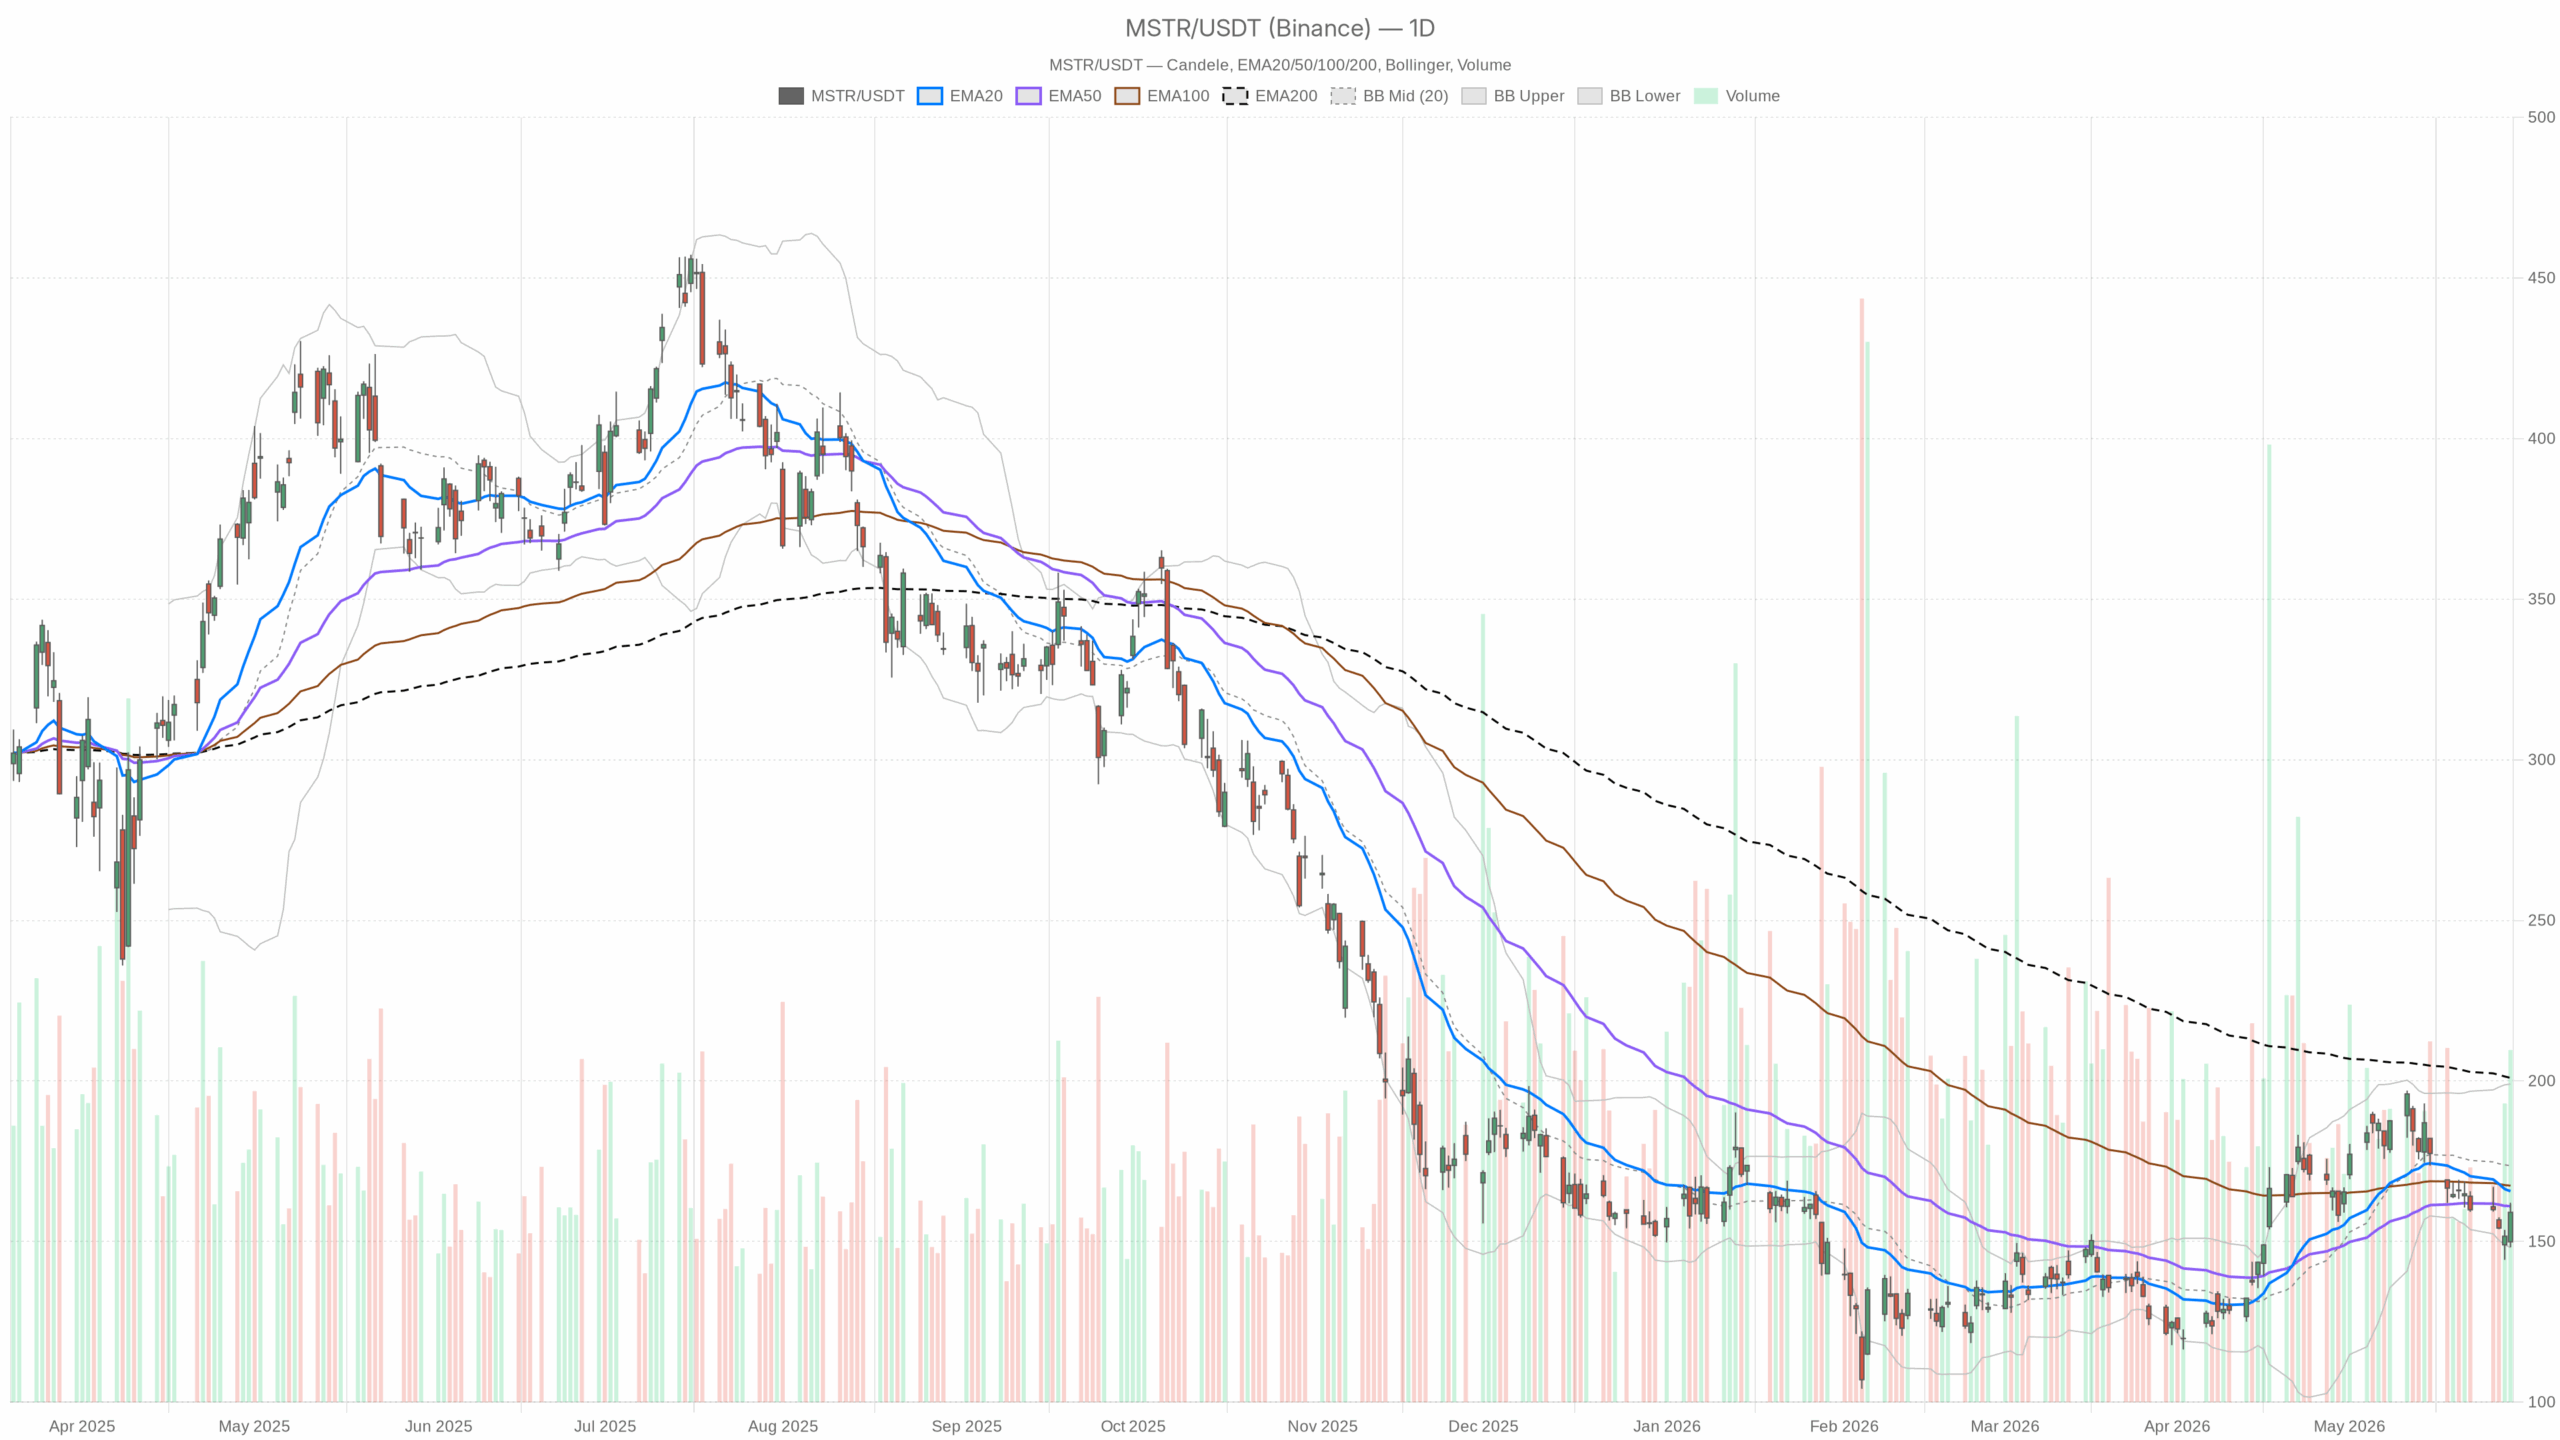
On the daily chart, MSTR closed at 159.09 with volume of 19.18M (active session interest). Price sits below the 20‑day EMA 165.66 and the 50‑day EMA 161.03, keeping the trend soft as sellers retain the edge. It also remains well under the 200‑day EMA 200.96, so long‑term pressure persists.
Momentum, Bands, and Volatility
RSI(14) 45.8 sits below neutral, and buyers lack control. Meanwhile, MACD shows a line at −1.41 versus signal at 2.43 with a −3.84 histogram, signaling downside momentum. Bollinger Bands place the mid at 173.58 and the lower band near 148.11; price is in the lower half, so rebound attempts face overhead supply.
ATR(14) 10.7 keeps daily swings elevated, which argues for wider risk buffers. Daily pivots mark PP 156.45, R1 164.70, and S1 150.84. Therefore, 159 sits above PP, but resistance stacks quickly into 165.
Headlines and Event Risk for Strategy Stock (MSTR)
Headlines keep event risk high. The company noted capital market actions, including repurchasing $1.5B in convertibles between May 11–25 (balance sheet work can cushion drawdowns). Notably, TD Cowen lifted its target to $400 with a Buy rating, which is sentiment supportive. A reported 411 BTC transfer and debate over the Bitcoin‑heavy structure underscore asymmetric outcomes, so headline volatility remains elevated.
Intraday Structure: Hourly Tape
At the same time, the 1H tape has improved. Price is above the 20‑hour EMA 156.50 but just under the 50‑hour EMA 160.07 (intraday upturn, recovery incomplete). It remains below the 200‑hour EMA 163.99, so bigger overhead supply is still in place.
RSI(14) 54.55 is positive on the margin, giving bulls near‑term control. MACD histogram is +1.33 with the line at −0.26 and signal at −1.59, a bullish turn in hourly momentum. Bollinger mid is 154.32 with the upper band at 162.60; price is riding the upper half, and bids are present. ATR(14) 3.8 confirms brisk intraday ranges.
The hourly pivot prints PP 159.00 with R1 160.24 and S1 158.03. Therefore, 159 is the battleground.
15‑Minute Context and Micro Levels
In the 15‑minute view, price is above the 20‑EMA 158.39 and 50‑EMA 156.46 but below the 200‑EMA 160.39, so the near‑term bounce sits under resistance. RSI(14) 57.16 is constructive. MACD shows a small negative histogram of −0.47 with the line at 1.19 and signal at 1.66, a micro stall after the pop.
The mid Bollinger is 159.71, which is immediate resistance on pushes. ATR(14) 1.26 keeps the tape scalp‑friendly but noise‑prone. The 15‑minute pivot sits at 159.13 with R1 160.11 and S1 158.31, offering tight levels to time entries around 159.
Strategy Stock (MSTR) Bullish Triggers
Therefore, the bullish scenario hinges on reclaiming and holding 161 first (50‑day EMA) and then 164.70 (daily R1). A subsequent push through 165.66 (20‑day EMA) would confirm control and open 173.58 (daily Bollinger mid) as the next upside magnet. If momentum continues, 162.60 on the hourly upper band must convert to support on dips for intraday confirmation.
Bearish Setup and Risk Levels
On the other hand, rejection in the 160–166 zone followed by a drop below 156.45 (daily PP) would hand control back to sellers. That would expose 150.84 (daily S1) and the 148.11 lower Bollinger band, with risk of a retest of the recent lower zone. With daily RSI 45.8 and a negative MACD histogram, downside follow‑through would not be surprising. A daily close back under 156, and especially under 151, would invalidate the bullish case near term.
Bias, Range, and Risk Management
Overall, the daily bias is neutral with a bearish lean until MSTR can sustain trade above 161–166. Position sizing should respect the elevated daily ATR 10.7 and the headline sensitivity around the firm’s Bitcoin exposure. Still, expect a choppy range between 150 and 166 until a decisive break resolves direction.
0
0
 Manage all your crypto, NFT and DeFi from one place
Securely connect the portfolio you’re using to start.