Story (IP) Pushes to New Highs Amid Market Pullback as Capital Inflows Strengthen

0
0

Layer-1 (L1) coin IP has emerged as today’s top gainer, soaring nearly 10% over the past 24 hours. The rally contrasts the 2% dip in overall market capitalization, signaling growing investor interest in the altcoin.
IP has gained 45% in just one week, setting a new all-time high of $14.92 yesterday. With climbing trading activity, on-chain and technical indicators suggest that the rally may have more room to run.
IP Momentum Builds as Derivatives and Spot Markets Align
According to Coinglass, IP’s long/short ratio is at 1.01 at press time, reflecting the bullish tilt in sentiment among the altcoin’s derivatives traders.
For token TA and market updates: Want more token insights like this? Sign up for Editor Harsh Notariya’s Daily Crypto Newsletter here.
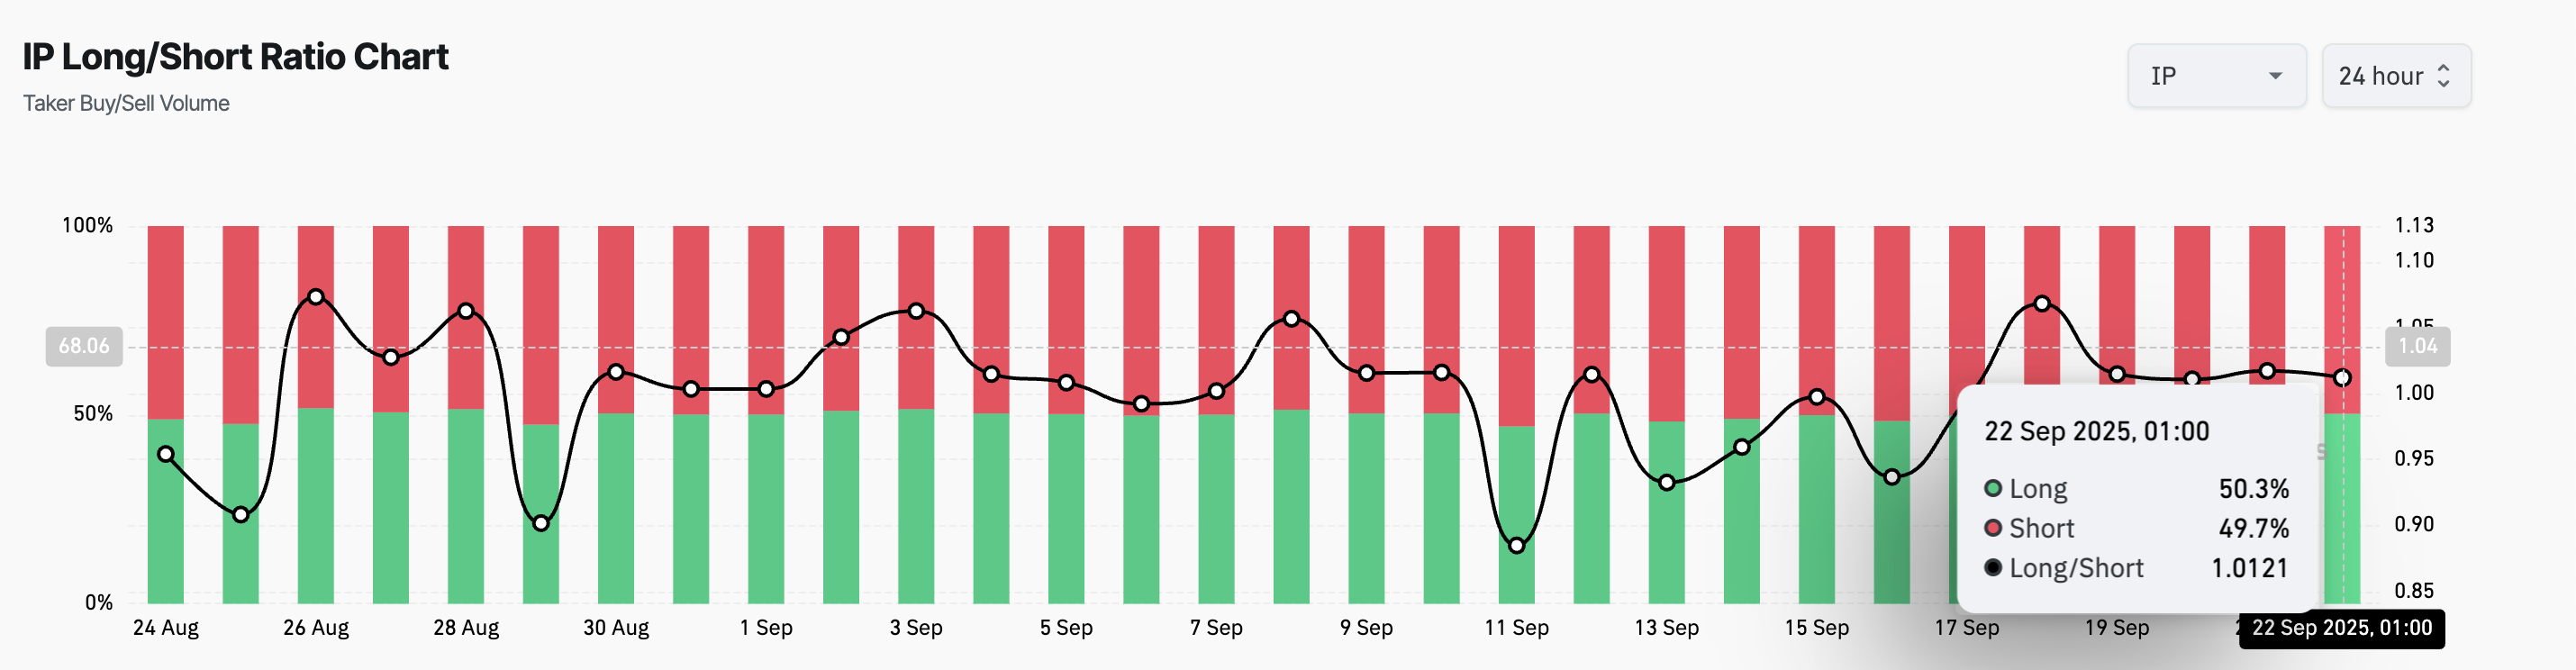 IP Long/Short Ratio. Source: Coinglass
This ratio compares the number of long and short positions in the market. When an asset’s long/short ratio is above one, it indicates that more traders are opening long positions than shorts, betting on a further rise in price.
Conversely, a reading below one would suggest that traders expect a pullback or decline in value.
For IP, the ratio’s position above one highlights the broader optimism surrounding the altcoin. It shows that its derivatives traders are increasingly aligning with the spot market momentum as they continue to take positions that fuel expectations that the coin’s rally may continue in the short to medium term.
Moreover, the surge in IP’s On-Balance Volume (OBV) in recent sessions confirms this bullish outlook. This momentum indicator is 30.77 million at press time, up 20% since September 16.
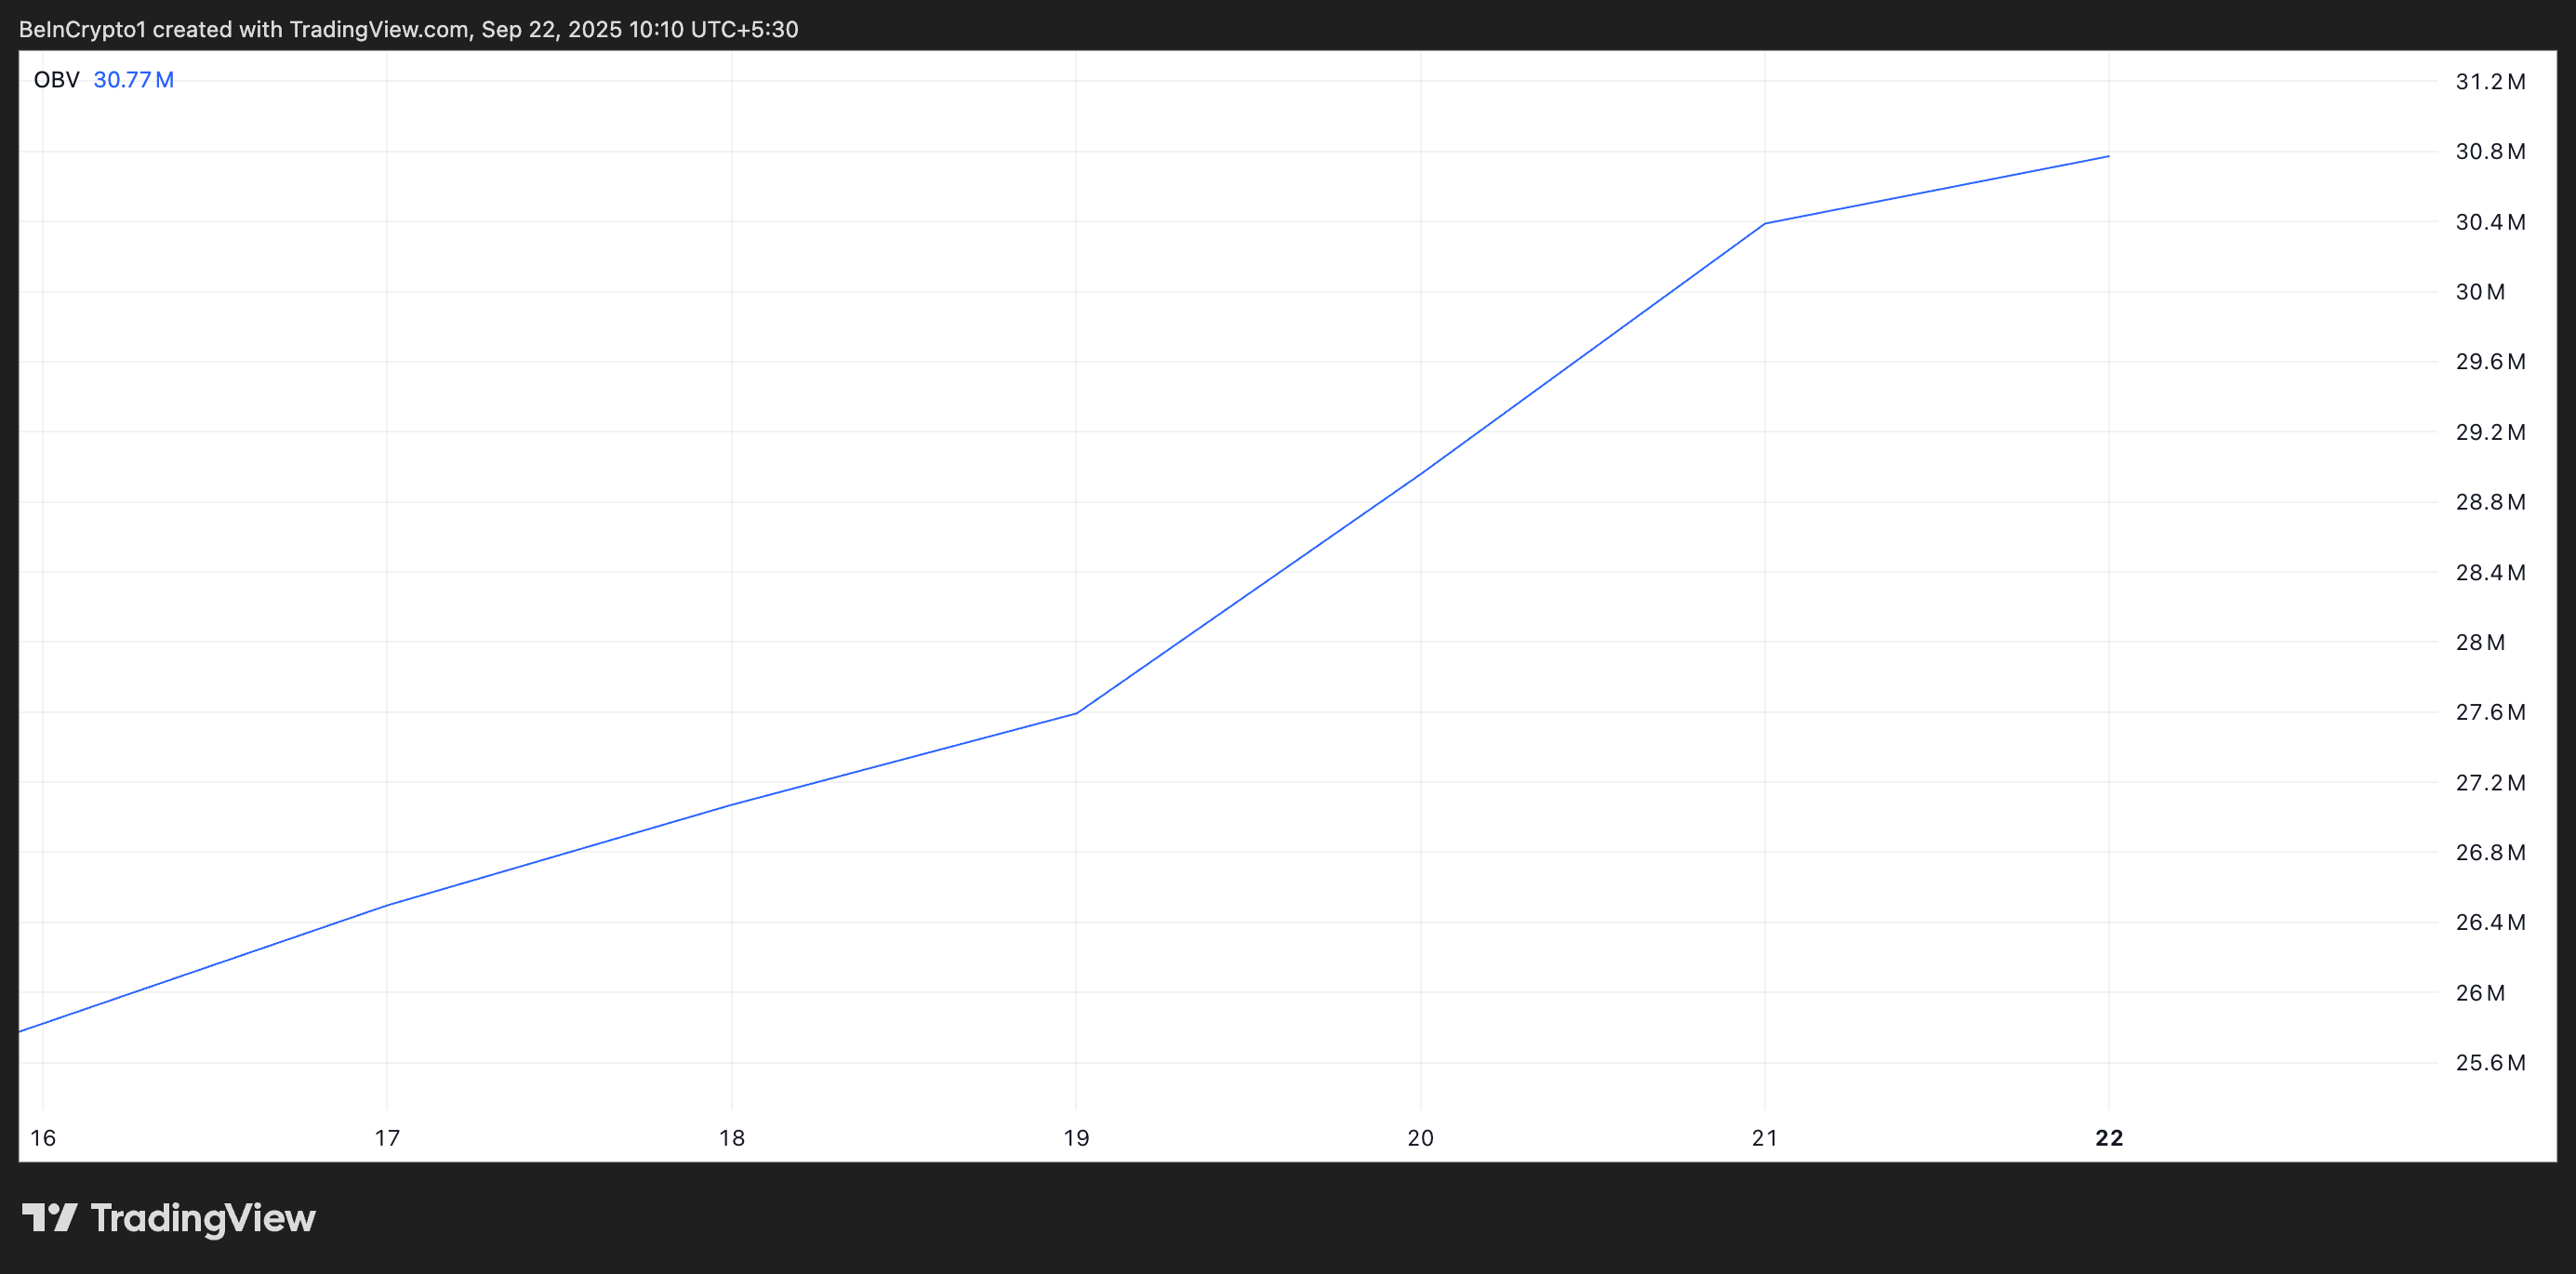 IP On-Balance Volume. Source: TradingView
The OBV indicator measures buying and selling pressure by tracking volume flow relative to price movements. It rises when trading volume is heavier on up days and falls when volume is stronger on down days.
When this momentum indicator surges, capital inflows outpace outflows, suggesting sustained accumulation in the market. This validates IP’s current trend and shows that the gains are supported by real buying pressure rather than speculative spikes alone.
IP Bulls Eye New Highs, But Bears May Test $12 Support
The continued preference for long positions among derivatives traders and rising demand in the spot market suggest that IP could extend its recent gains.
In this scenario, the altcoin has the potential to reclaim its all-time high of $14.92 and push beyond it to establish new price peaks.
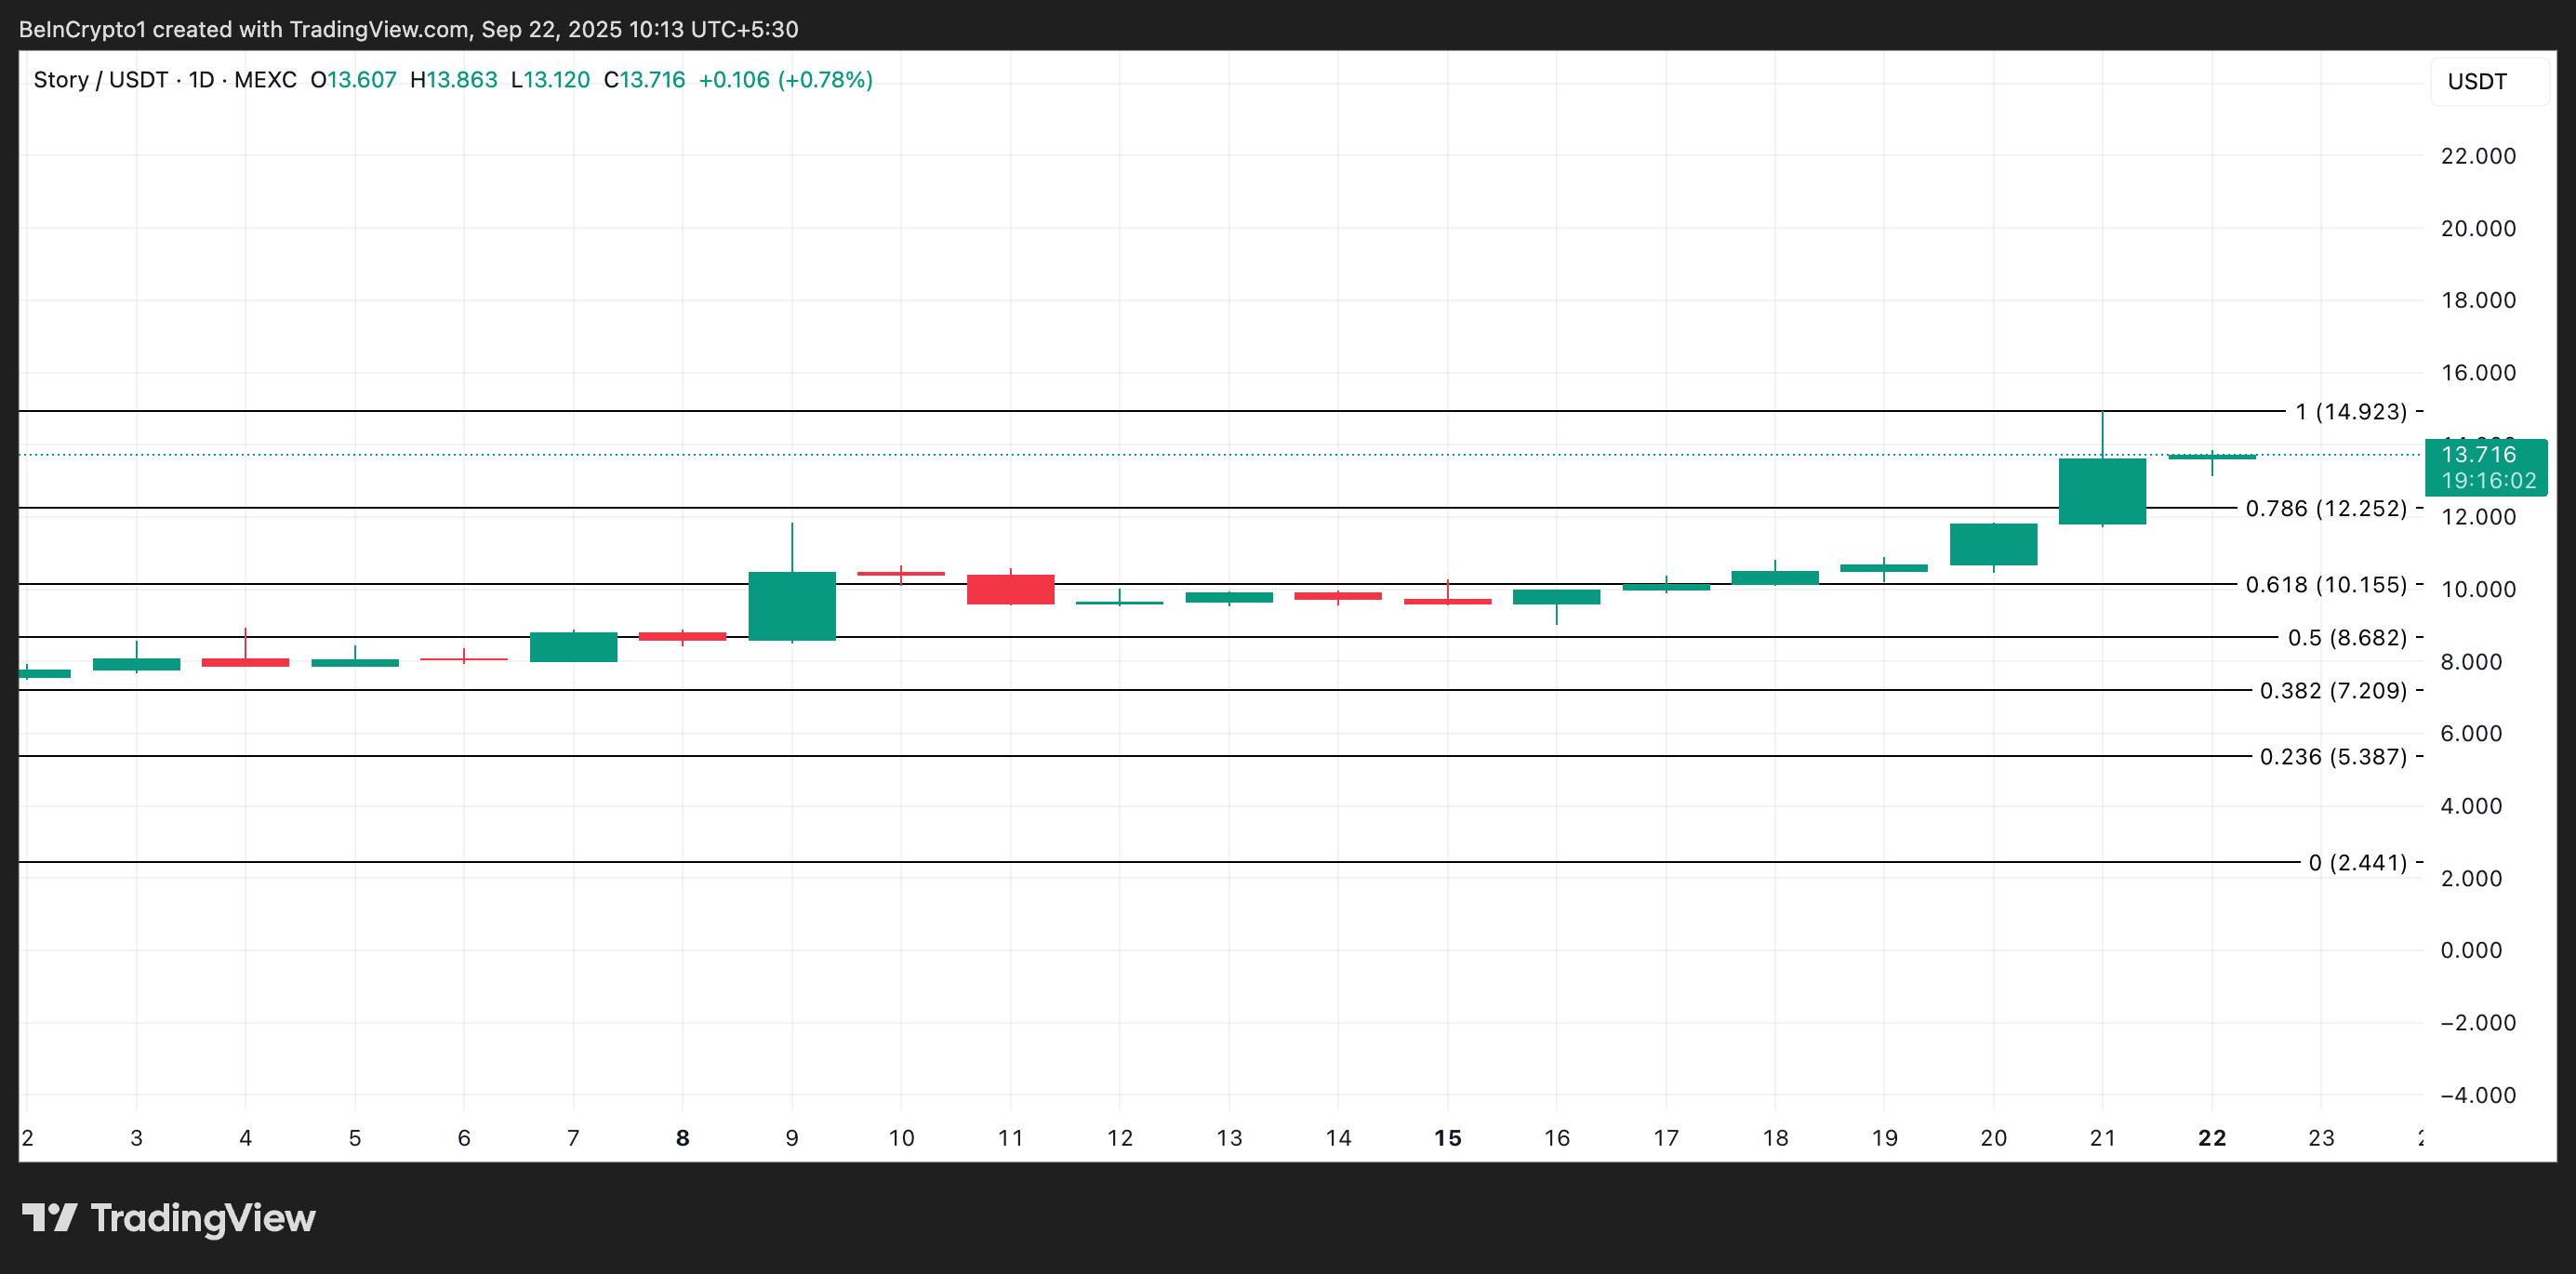 IP Price Analysis. Source: TradingView
However, this outlook comes with risks. A slowdown in demand coupled with aggressive profit-taking could reverse the current uptrend, sending the coin back toward the $12.25 support floor.
If this level fails to hold, IP’s price could face a deeper correction to $10.15.
0
0


 Manage all your crypto, NFT and DeFi from one place
Securely connect the portfolio you’re using to start.


0
0