Ethereum Gains 7% in April. What is the Outlook for May?

0
0

Ethereum is currently trading at $2270. It shows signs of recovery after several days of consistent downtrend.
The current week is arguably the most bearish of April. It lost more than 5% over the last three days but printed a doji on Thursday. The current recovery is buoyed in fresh macro fundamentals from the US.
The United States BLS released the initial jobless claims and a flurry of other data a few hours ago. Breaking down the reports, initial jobless claims came in at 189,000, down 26,000 from the previous week. Additionally, GDP came in at 2% higher than the previous reading.
Aside from these two, personal income rose, reducing inflation concerns. These led investors to become optimistic, flooding the crypto market with fresh liquidity.
The global cryptocurrency market cap rose significantly as a result. Valuations quickly climbed above $2.54 trillion as several major coins reclaimed lost levels. Traders are now anticipating further increases in the coming days.
It remains to be seen whether the BLS reports can sustain an uptrend. Nonetheless, trading volume over the last three days has dwindled, reducing its likelihood. For example, the US spot ETF saw a total net inflow of -$87 million on Wednesday.
The last time it saw such a large negative net flow was on Mar 26, when net inflow was -$92 million. Additionally, the large outflow will mark the third consecutive one this week.
Recent data from CryptoQuant shows that exchange inflows have also risen gradually over the last three days. For example, on Monday, 819,590 ETH flowed into trading platforms, and on Wednesday, the figures rose to 920,658.
While prices have been significantly down over the last three days, Ethereum is heading for a bullish close this April.
Ethereum Gained 7%
On the 1-week chart, Ethereum is edging closer to registering its first red candle after a 4-week uptrend. It gained over 6% in the week starting Mar 30, and has since reclaimed levels it lost over the last two months.
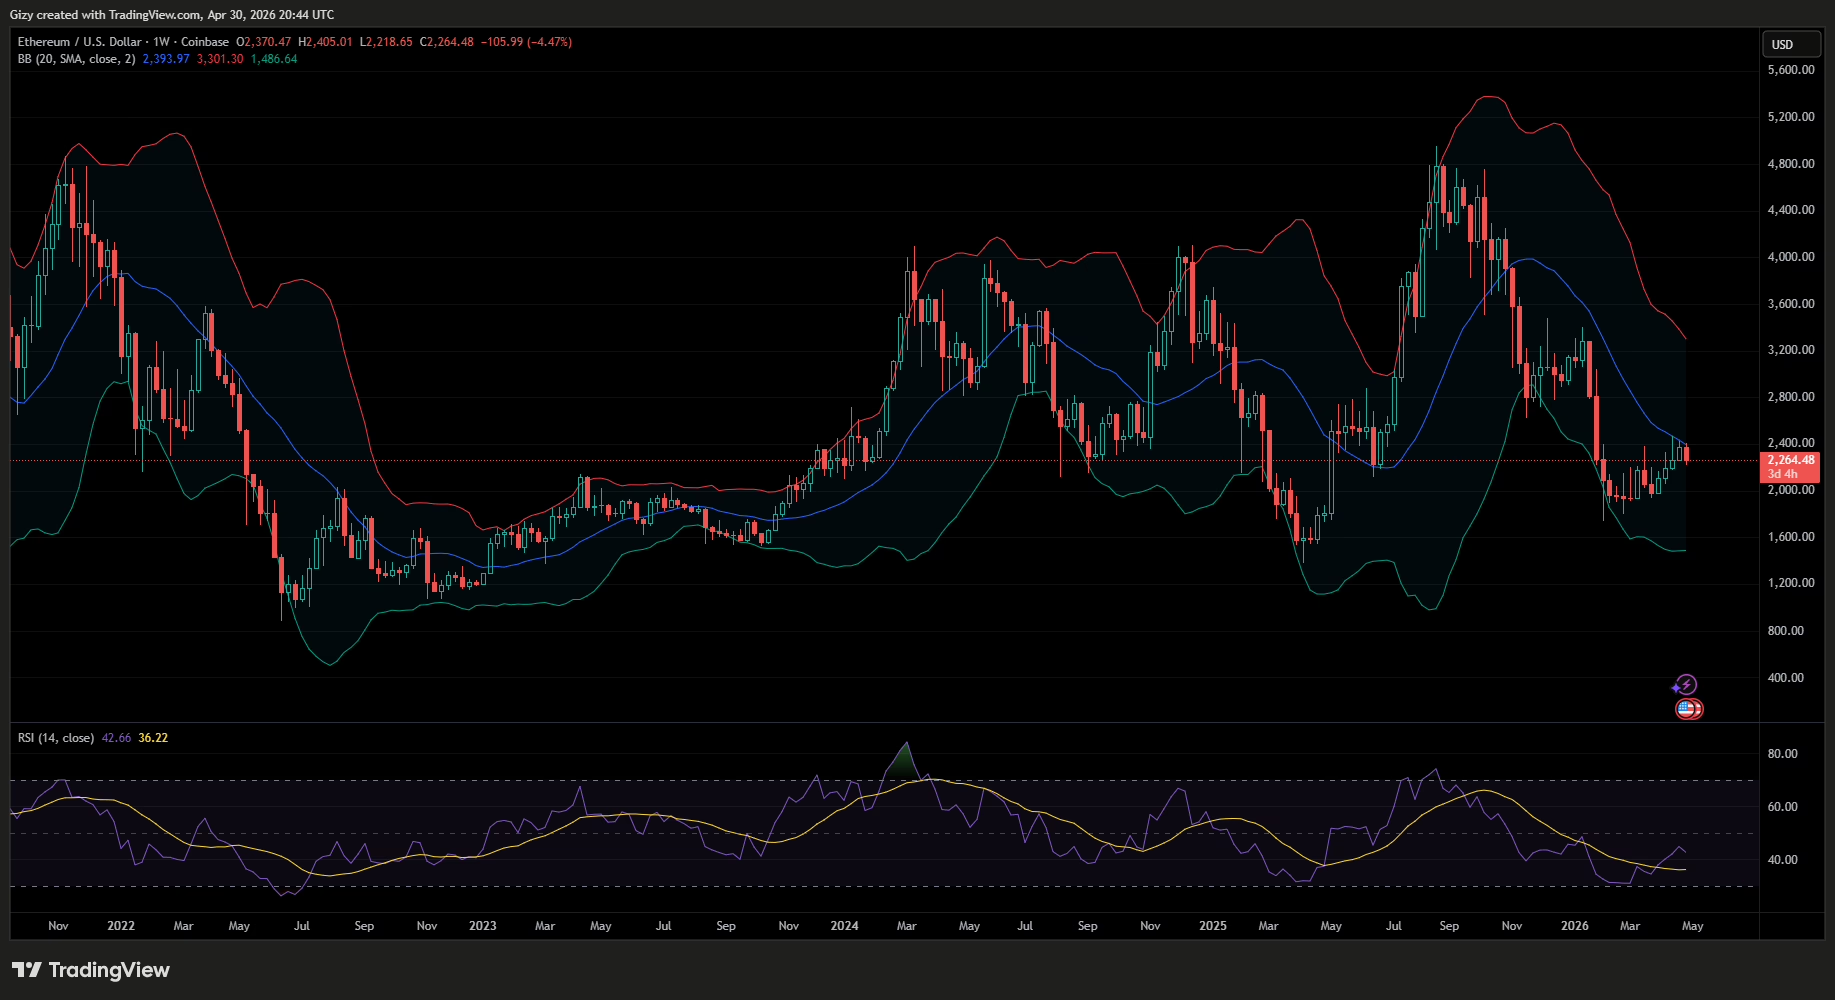
One such is the $2,390 (its two-month high), which it flipped two weeks ago. It went on to register its 1-month high of $2,466. However, it failed to remain above $2.4k for long.
Nonetheless, the altcoin may end the month with gains of more than 7%. It marks the continuation of March’s uptrend, during which Ethereum surged by a similar margin.
On a closer inspection, the asset created a fair-value gap, which was filled over the last thirty days. The 1-month chart shows another extended wick in April. It remains to be seen if ETH will fill it.
Indicators on the 1-week chart suggest a reduced likelihood. Over the past two weeks, ETH has posted lower highs, but the Bollinger band on the 1-week chart indicates the altcoin is currently trading at a critical level. However, the uptrend slowed as prices approached the middle band.
The current price movement shows that the asset is losing its upward momentum. Selling pressure is likely to increase as the bulls show signs of exhaustion following the recent red candle. However, with the SMA acting as resistance at the moment, flipping it is important for the further uptrend.
According to this indicator, the uptick is over. However, the price movement will be determined next week. Ethereum stands to see notable gains if prices break above the middle band in May. On the contrary, if the altcoin gets another red candle, the possibility of a significant increase next month decreases.
Conversely, the bollinger bands on the 1-day chart indicate that the apex altcoin will surge higher. ETH broke out of the indicator two weeks ago when it registered its high. It soon retraced and rebounded off the lower band on Wednesday. After bouncing off the mark, the altcoin may continue upwards, breaking the upper band again.
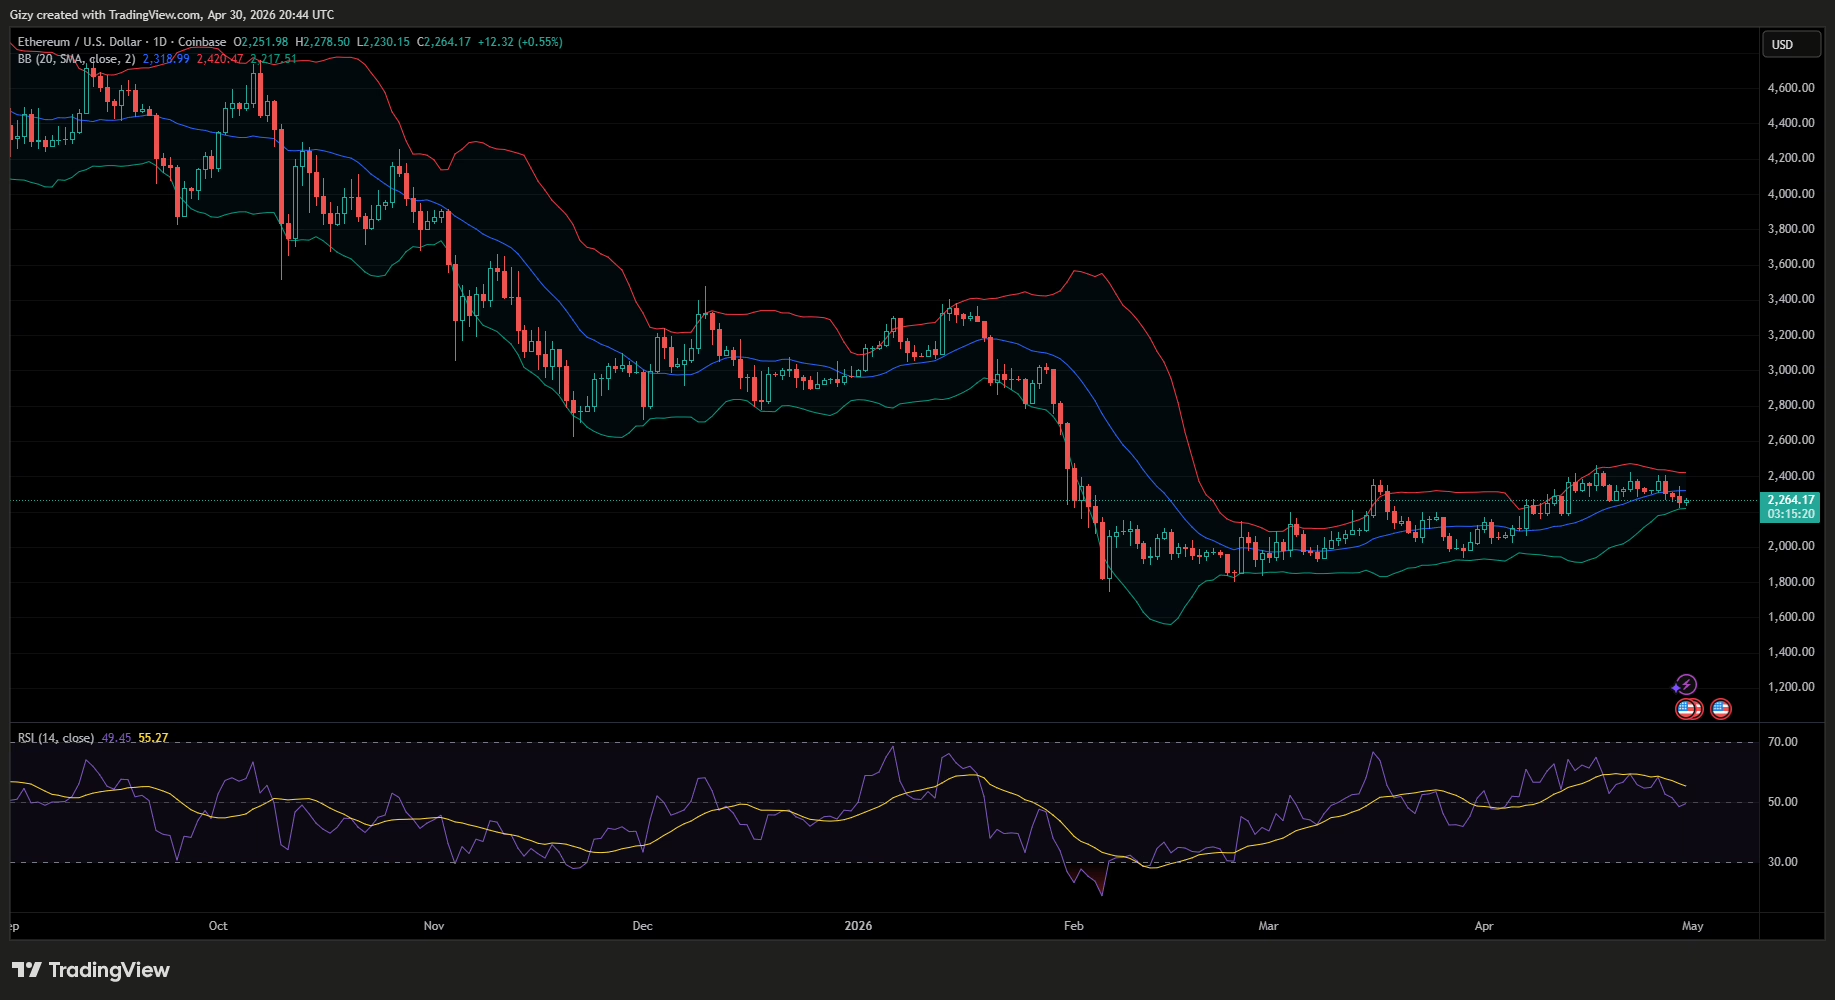
In summary, Ethereum may be off to a good start in May. The reading from the 1-day chart aligns with historical records.
Ethereum Heads Into Its Most Profitable Month
Based on historical data, May is the most profitable month for Ethereum. On average, it gains over 31%, with the highest increase in 2017 (190%) and the largest loss in 2022 (29%).
However, a 31% surge is unlikely in the coming month. The median for the fifth month is 12%. Such an increase will see prices surge above $2,500. In summary, ETH is gearing up to register its third consecutive green on the 1-month chart.
Nonetheless, other assets in its ecosystem will benefit from the bullish sentiment surrounding the apex altcoin when it surges. For example, a previous analysis noted that Arbitrum is at a crossroads. If it surges next week and flips bollinger middle band, it may end the coming month with notable improvement in price. A green Ethereum will bolster its buying pressure.
Additionally, ETC is gearing up for another upward run. Like ETH, the BB on the 1-day chart indicates that the altcoin will surge higher. Ethereum Classic broke out of the indicator two weeks ago when it registered its high. It soon retraced and rebounded off the lower band on Wednesday. After bouncing off the mark, the altcoin may continue upwards, breaking the upper band again.
The post Ethereum Gains 7% in April. What is the Outlook for May? appeared first on CoinTab News.
0
0

 Manage all your crypto, NFT and DeFi from one place
Securely connect the portfolio you’re using to start.


0
0

0
0

0
0