Why Is The Crypto Market Down Today?

0
0

The crypto market (TOTAL) is pulling back on Friday as weekend liquidity thins, US equities close red, and oil climbs above $104 on renewed Iran tensions.
TOTAL slipped 1.35% from yesterday’s high to sit at $2.57 trillion, as the $2.60 trillion resistance held firm. Bitcoin (BTC) trades at down 0.68% on the day, while Quant (QNT) leads the losers at $71.30, down roughly 3% over 24 hours.
In the news today:-
- Wisconsin sued Kalshi, Coinbase, Polymarket, Robinhood, and Crypto.com, alleging their prediction market event contracts operate as unlicensed gambling rather than financial instruments.
- ARK Invest’s Q1 2026 Bitcoin Quarterly says the true cyclical bottom has not arrived, even as conviction buyers grew holdings 69% to 3.60 million BTC.
- Robinhood Ventures opened private stakes in OpenAI, Stripe, Revolut, and Databricks to retail investors and secured Singapore regulatory approval for brokerage expansion.
Crypto Market Cap Fails at $2.6 Trillion as Friday Liquidity Thins
The total crypto market cap printed an indecisive Doji candle on Wednesday near $2.60 trillion before turning red. It has now extended the slide by 1.35% off that high into Friday.
The pullback tracks a broader risk-off shift. The S&P 500 closed down 0.41% on Thursday as software stocks dropped. Brent crude pushed back above $104 on fresh Iran tensions, ending the ceasefire-driven rally.
The capital rotation thesis into spot equities has stalled, and with the weekend approaching, funds are thinning out rather than reallocating.
Want more token insights like this? Sign up for Editor Harsh Notariya’s Daily Crypto Newsletter here.
Lower liquidity into Saturday and Sunday historically amplifies moves against the prevailing direction, leaving the crypto market cap exposed if the $2.60 trillion overhead cap holds.
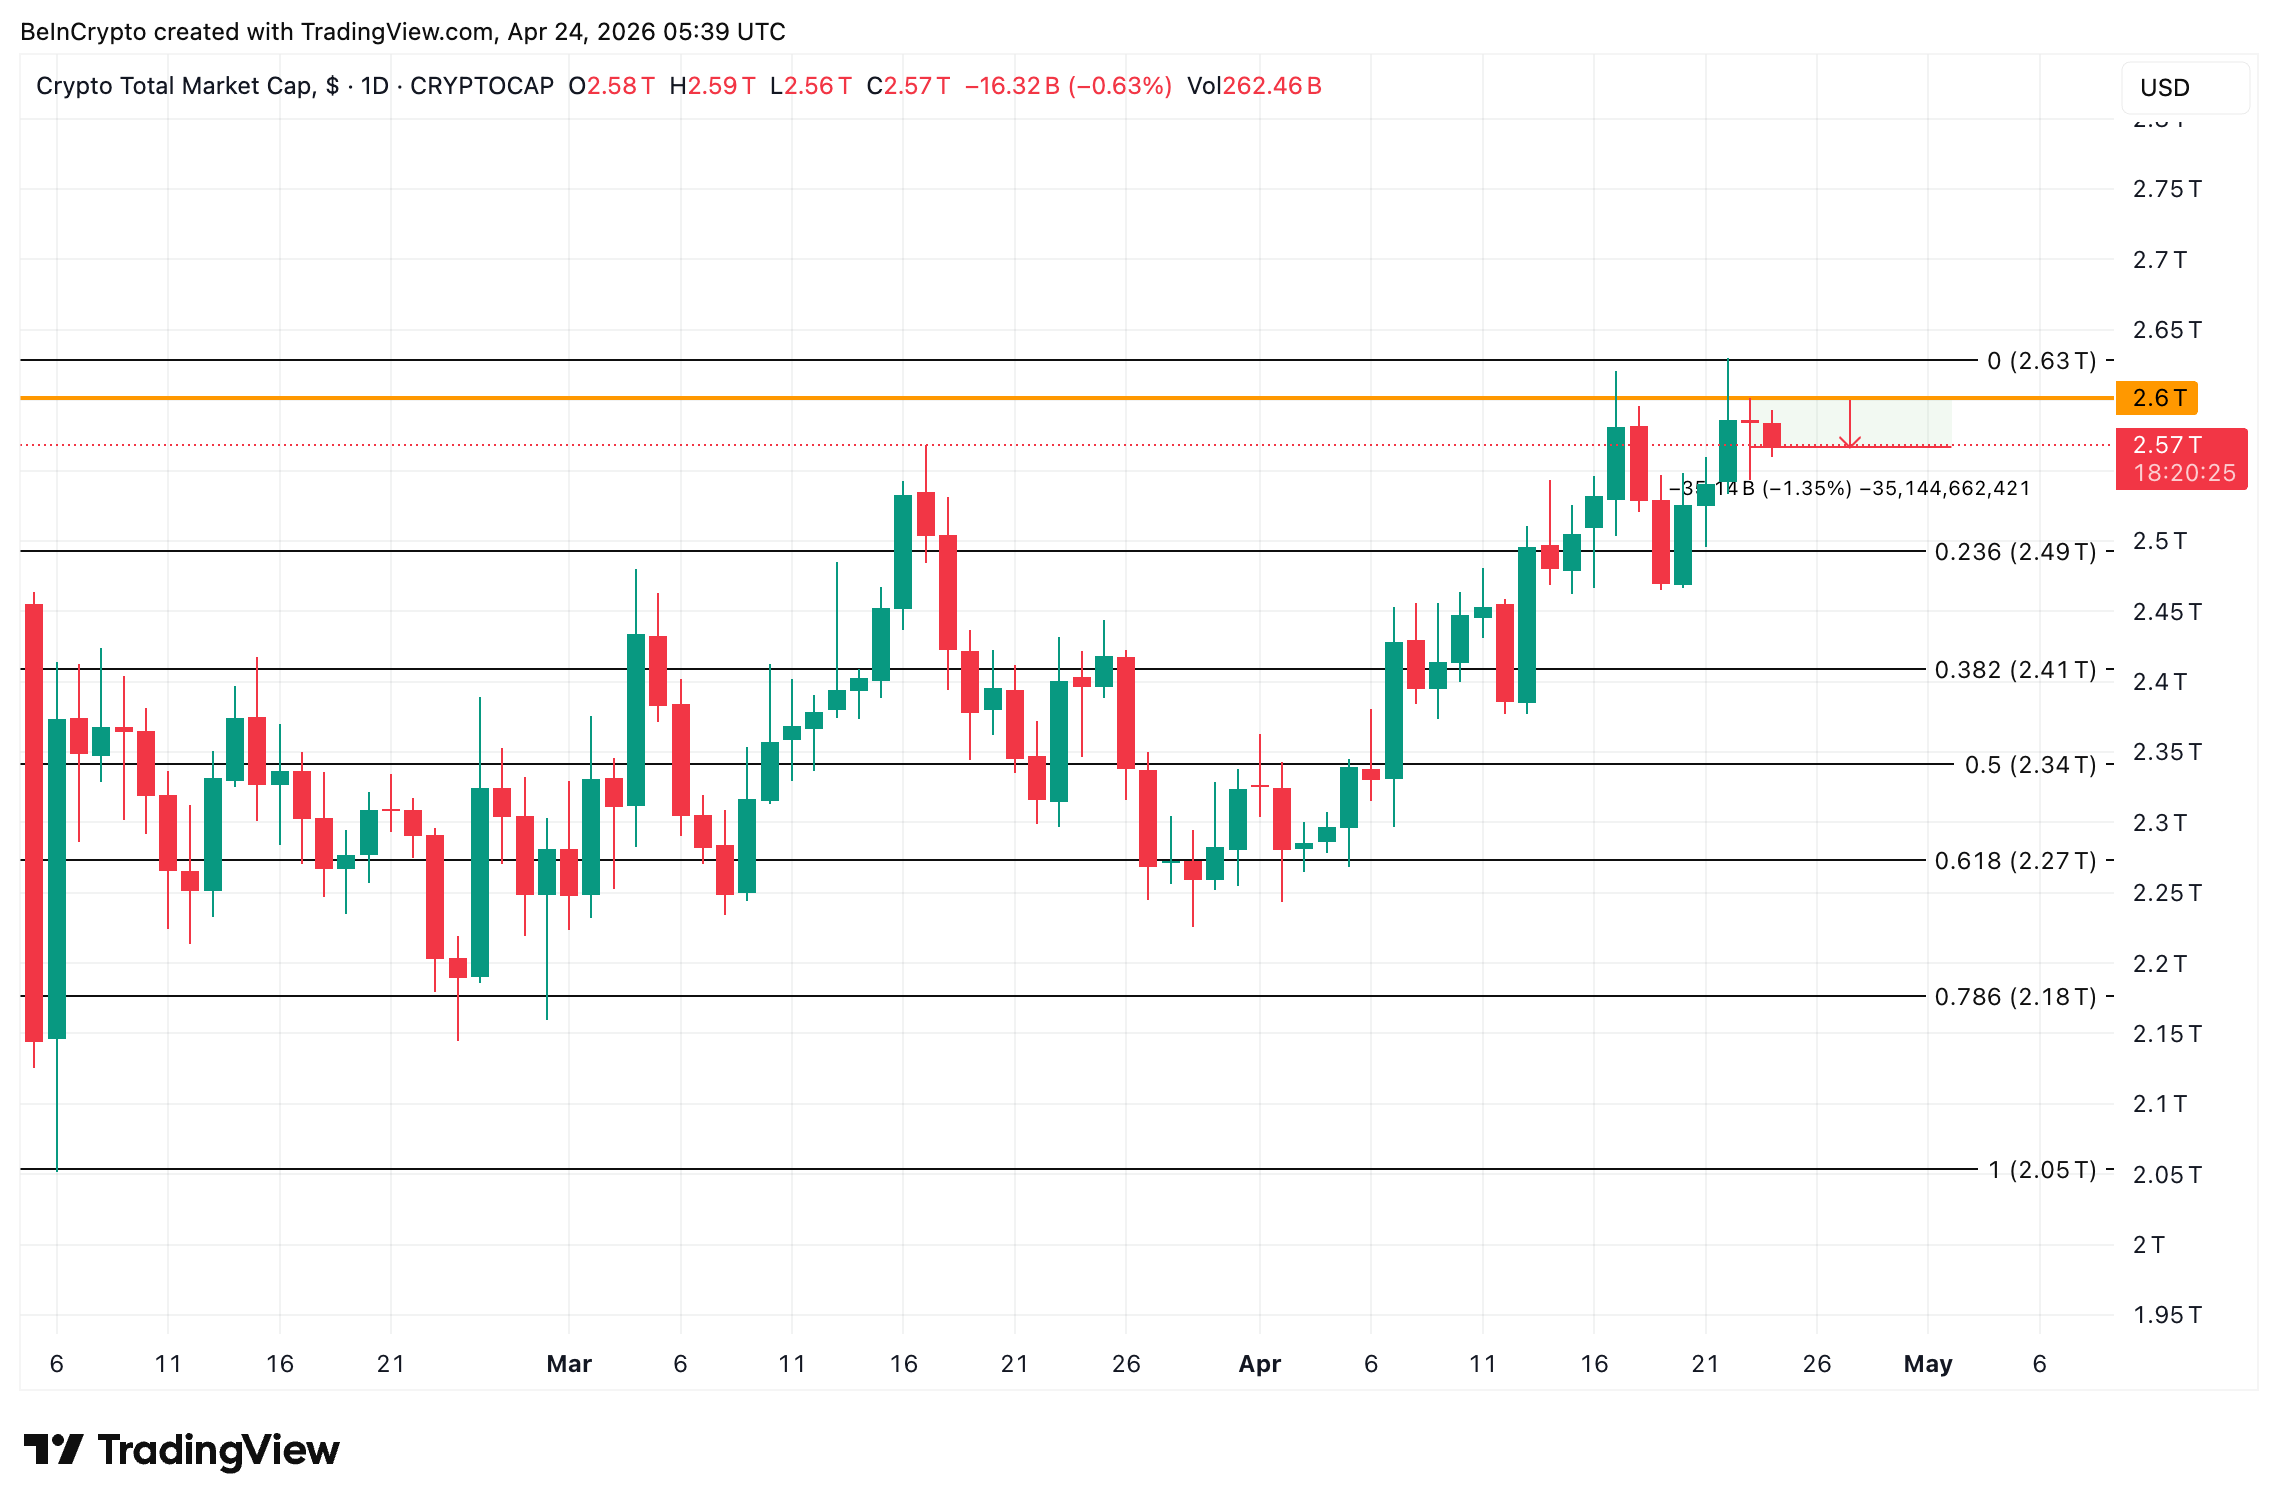 Total Crypto Market Cap Analysis: TradingView
The first test is $2.49 trillion if the broader crypto market corrects over the weekend. Any level above $2.49 trillion keeps a bounce in play. However, a break under $2.49 trillion opens downside toward the $2.41 trillion and $2.34 trillion zones. To gain strength, crossing $2.63 trillion is a must.
Bitcoin Price Holds $77,000 but Volume Signals Weakening Buying Pressure
Bitcoin trades at $77,751, roughly flat over 24 hours but up about 10% over the past month. On-chain stress still reads bullish on the surface, with Santiment data showing key stakeholder wallets accumulated 40,967 BTC over the past two weeks.
Beneath that signal, though, the volume bars tell a more cautious story. Between March 4 and April 22, BTC printed higher swing highs, while volume peaks trended lower. That divergence points to weakening buying pressure, which matches the broader risk-off tape driven by the oil surge and weak equities.
The decisive level is $79,501, the swing high from April 22 that formed on light volume. BTC needs a daily close above $79,501 to neutralize the volume warning and open a path higher.
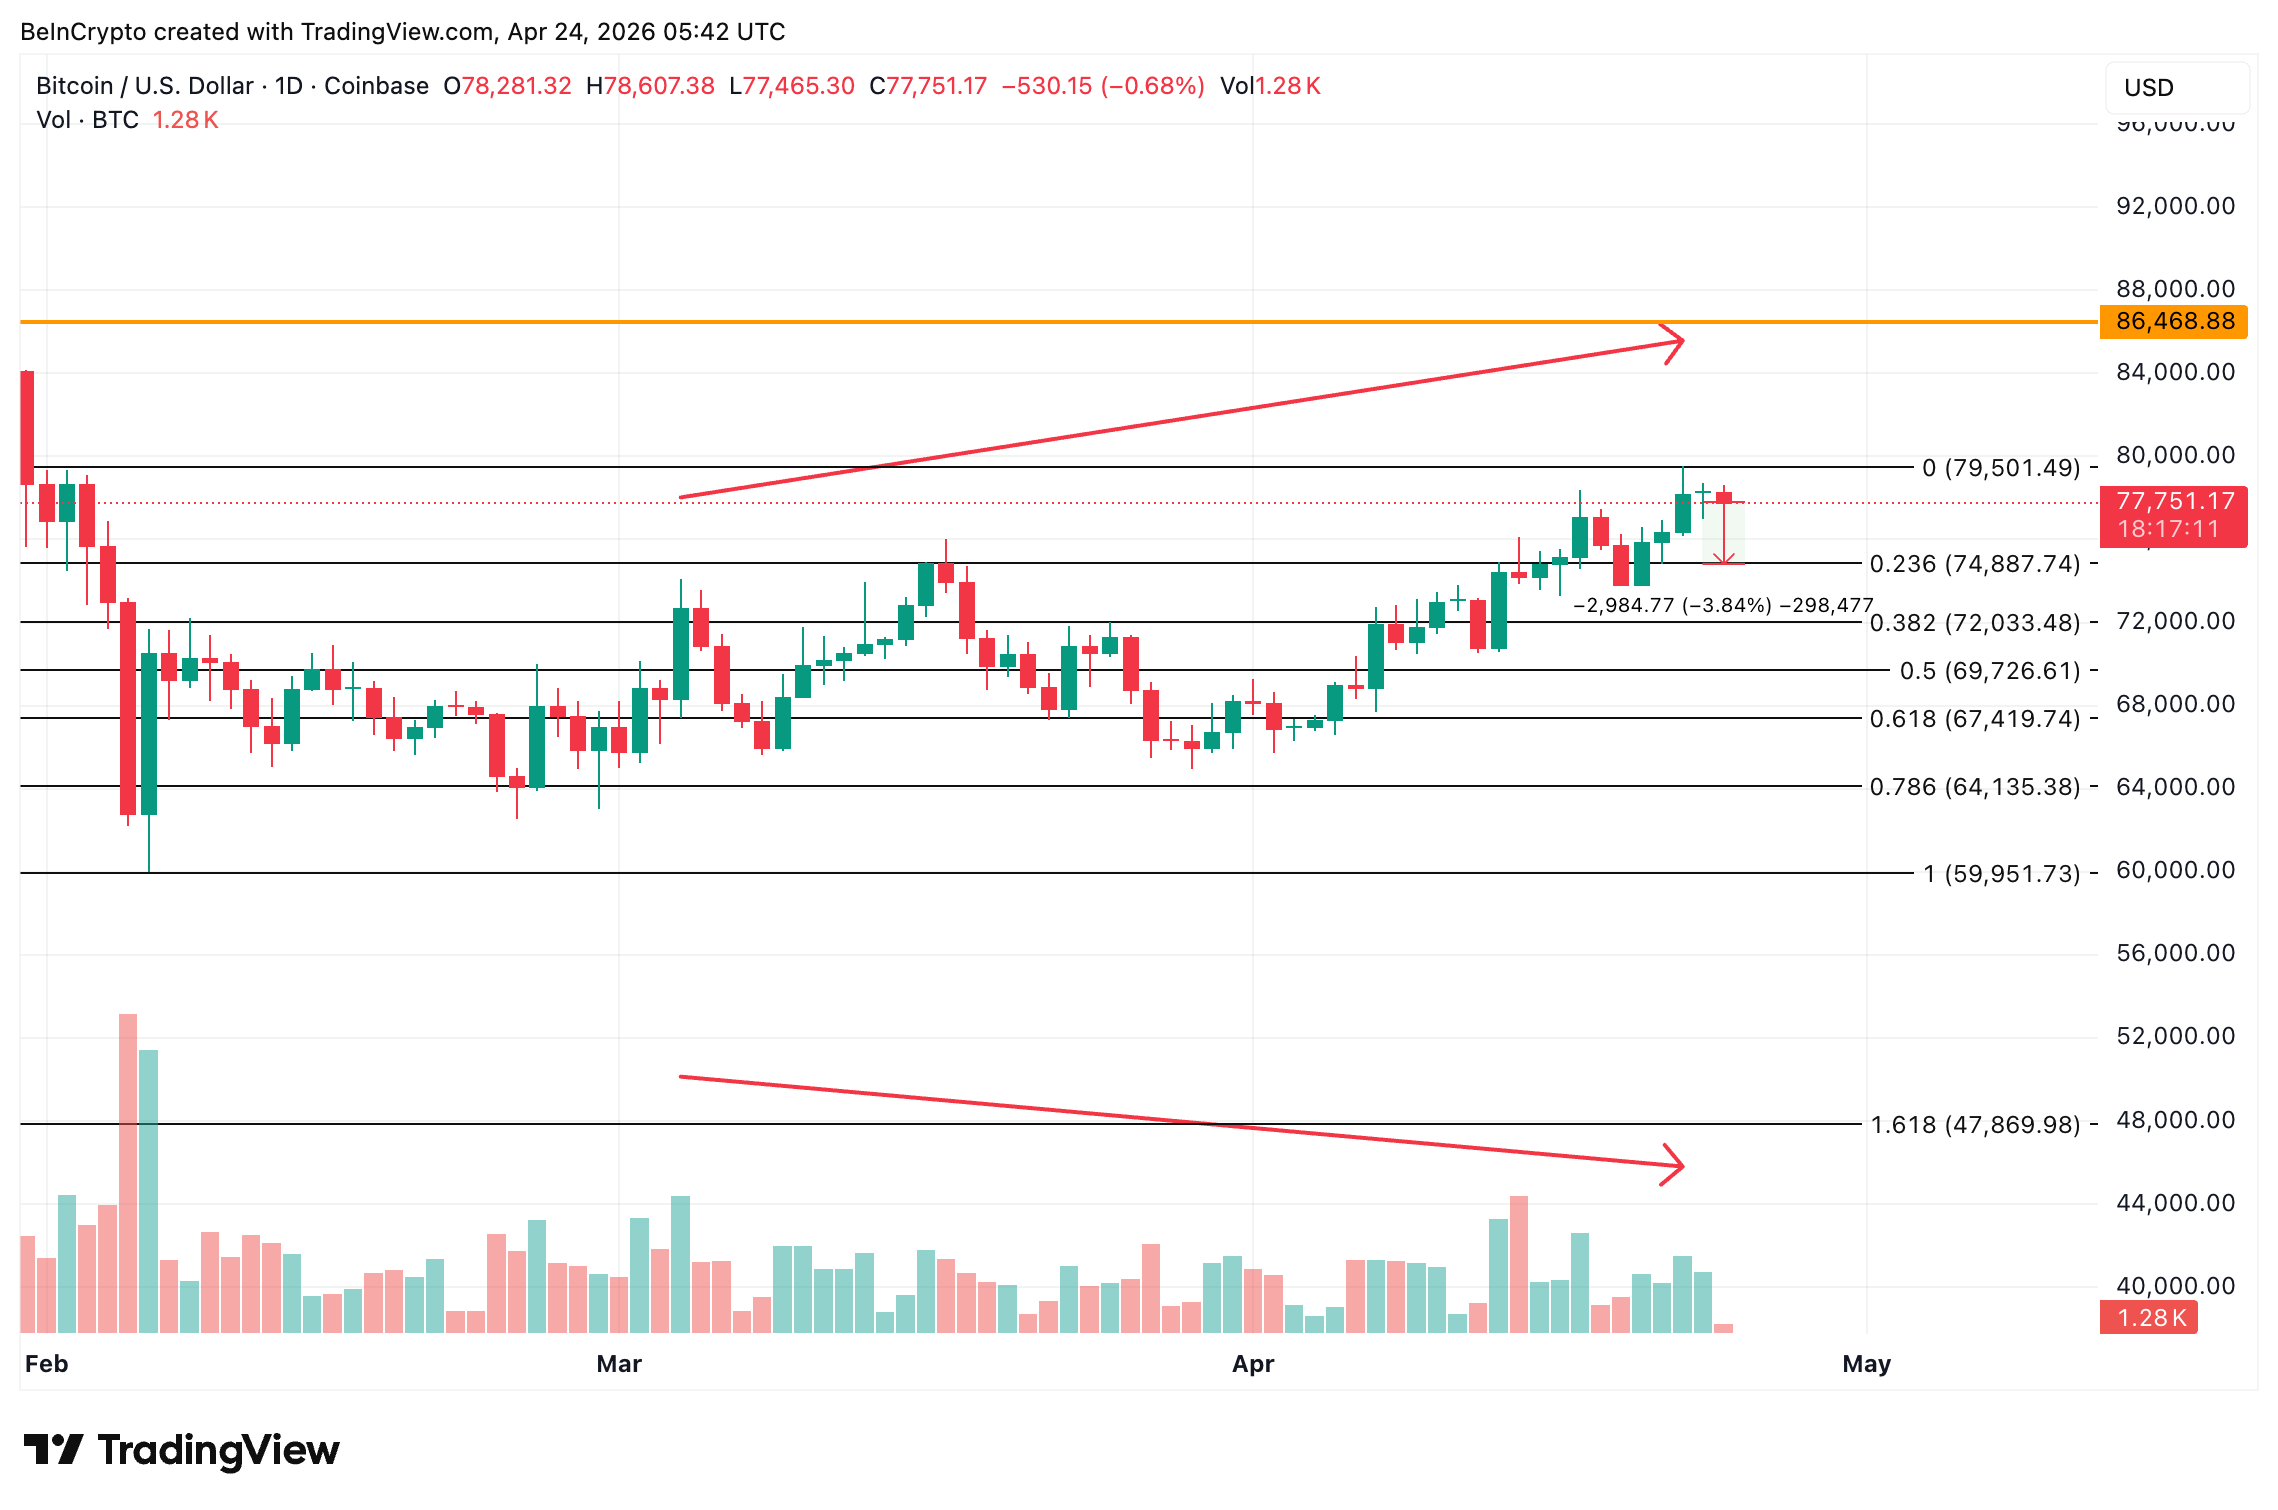 Bitcoin Price Analysis: TradingView
However, a failure to clear that level combined with weekend thinness exposes $74,887 as the first downside test. A break under $74,887 opens $72,033 and $69,726 as deeper support zones.
Quant (QNT) Price Drops 3% as Symmetrical Triangle Support Gets Tested
Quant (QNT) trades at $71.30, down roughly 3% over 24 hours but still up around 2.7% year-to-date. Ranked 67 at press time, this RWA token has been consolidating inside a symmetrical triangle since mid-January. This pattern often reflects a buyer-seller stalemate.
The April 17 correction pushed QNT below both its 20-day Exponential Moving Average (EMA) at $73.57 and 100-day EMA at $73.10. EMAs are trend lines that average out price over a set period.
With the 20-day line now closing in on the 100-day line, a bearish cross is looming, and the broader weekend liquidity thinness and oil-driven risk-off move leave QNT exposed.
The pivotal level is $70.95, the 0.382 Fibonacci level and the lower boundary of the triangle pattern. A breach opens $67.65 and then $64.34, a move that would mark a roughly 10% drop from current levels.
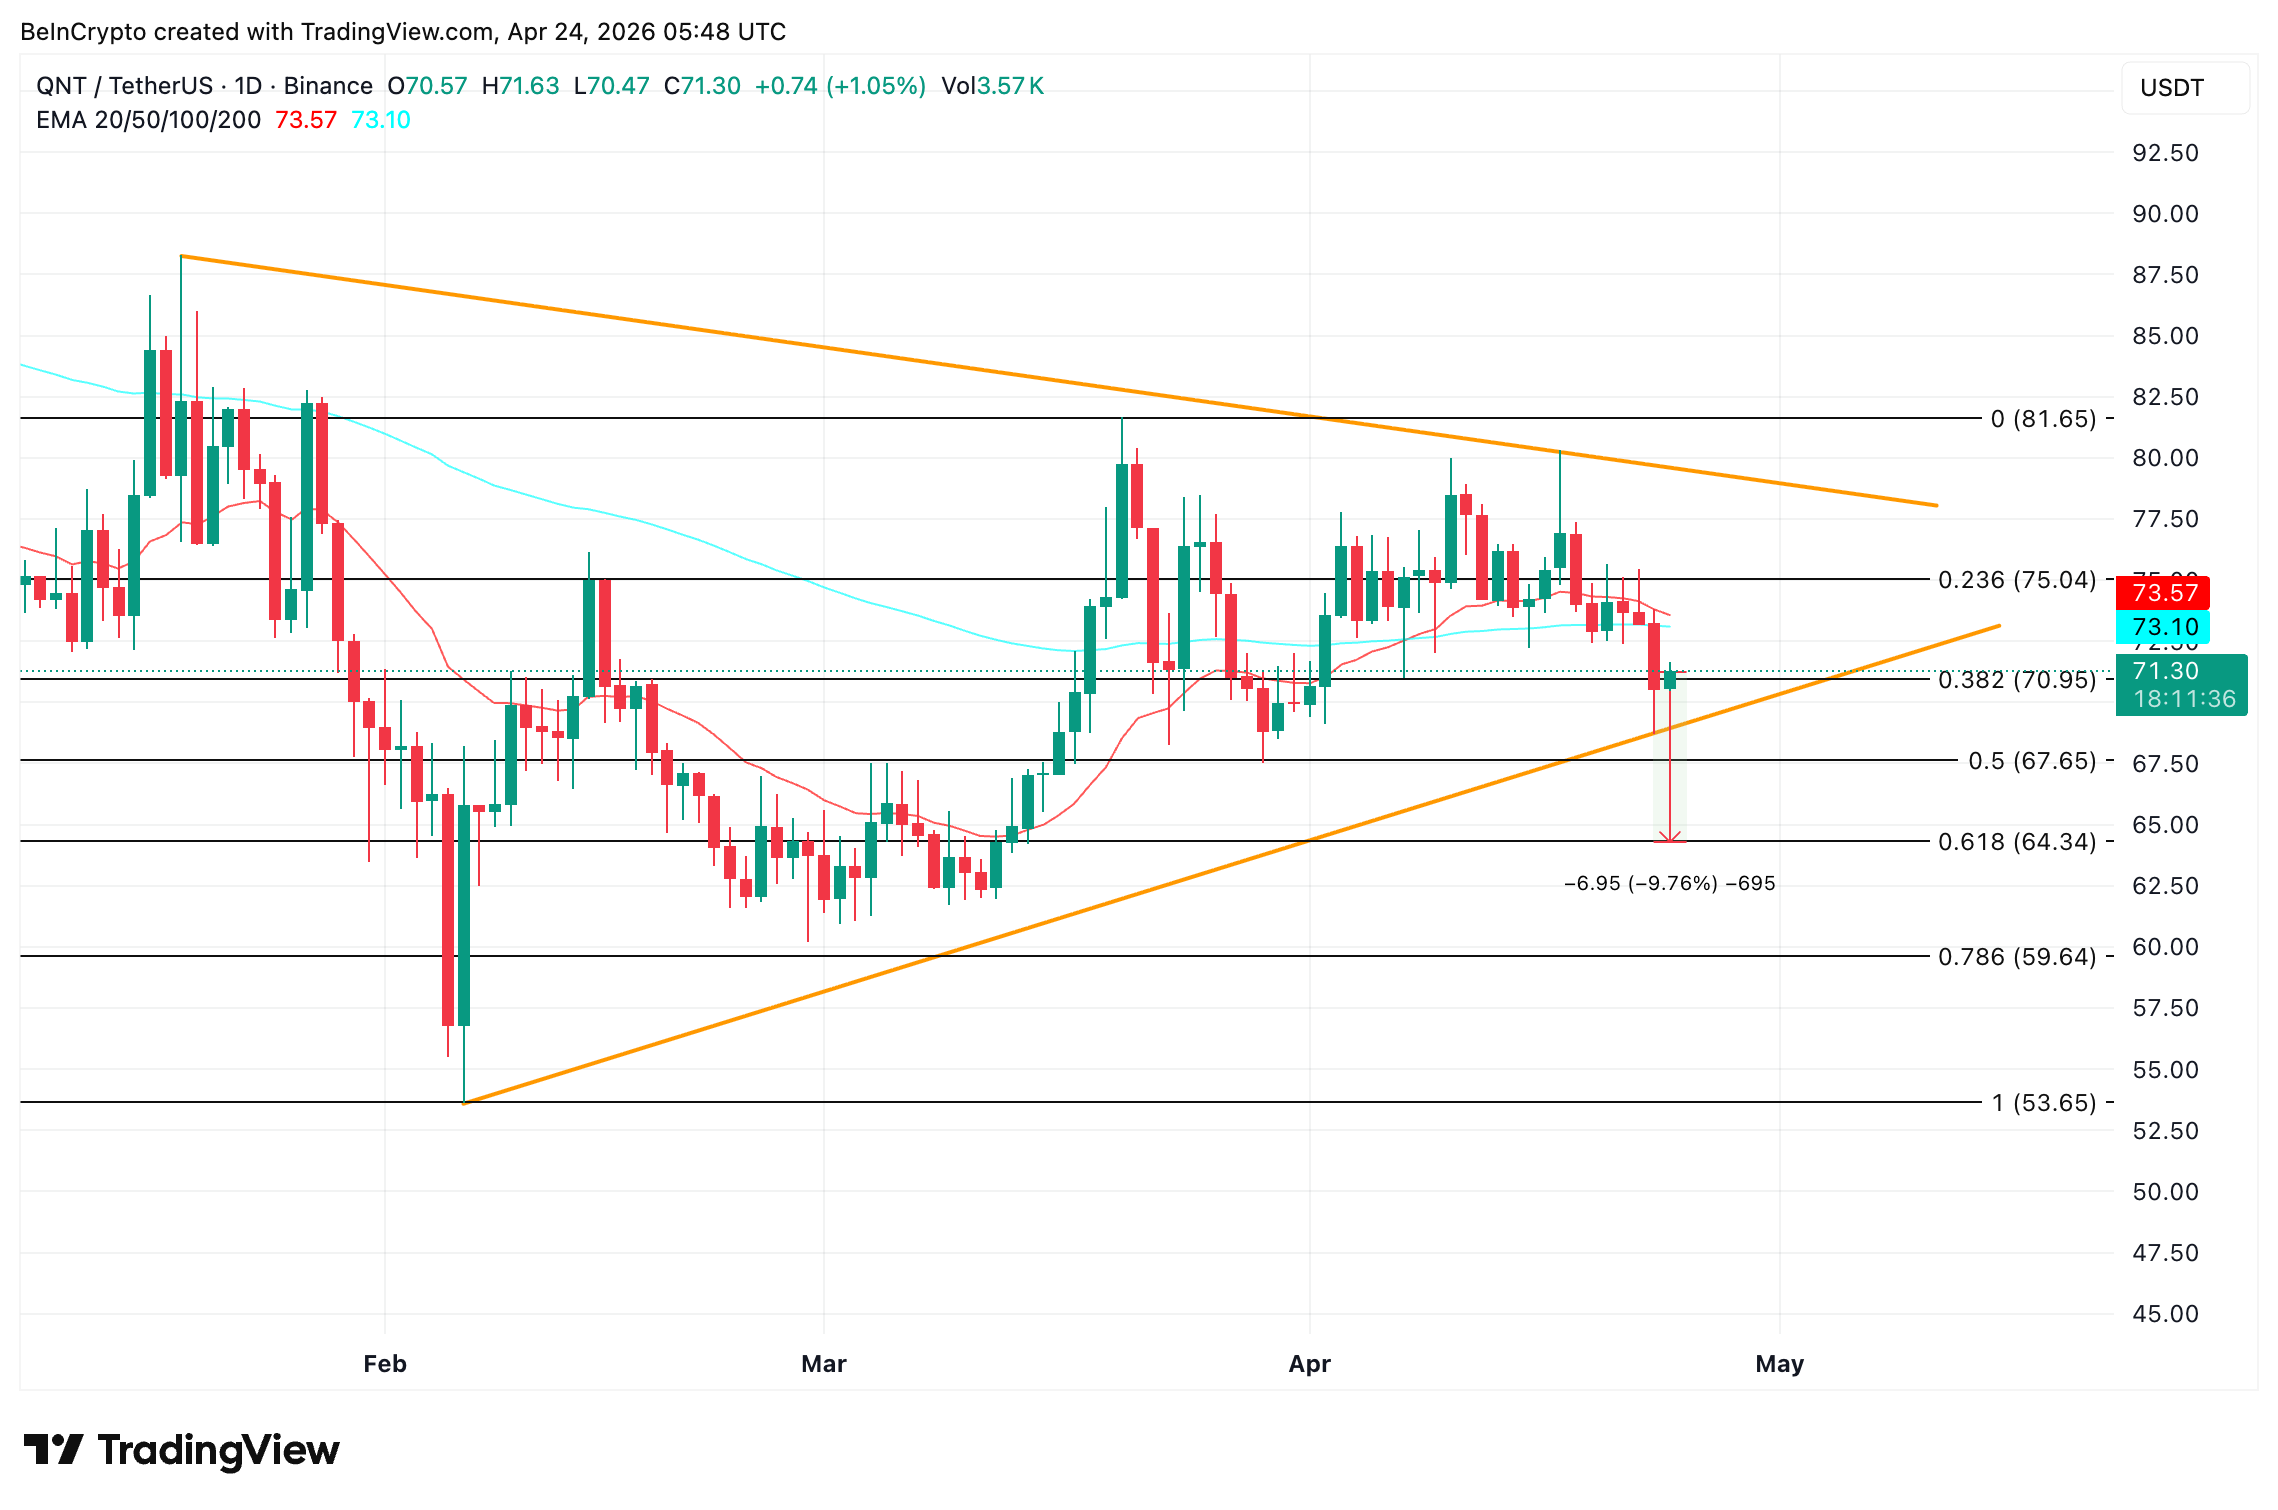 Quant Price Analysis: TradingView
Reclaiming the $73 EMA cluster and pushing above $75.04 would neutralize the setup. However, $81.65 is the real the upside test. For now, $70.95 separates a triangle breakdown from a reclaim attempt back toward the EMA cluster.
0
0


 Manage all your crypto, NFT and DeFi from one place
Securely connect the portfolio you’re using to start.

0
0

0
0

