XRP Price Eyes Rebound as Sell Signs Weaken

0
0

XRP is down 5.4% in the last 24 hours, and over 10.3% this past week, moving in sync with the broader market correction. Whale exits and short-term sell pressure have taken a toll. But beneath that surface, something is changing.
With 6,500 US pharmacies now accepting XRP for compliant payments through Wellgistics, utility is getting a real-world boost. And even before that news fully kicks in, key on-chain and chart metrics are flashing one message: XRP’s trend isn’t broken yet.
Percent Supply in Profit Drops; But That’s Historically Bullish
On August 17, XRP’s Percent Supply in Profit stood at 93.53%, the lowest in nearly two weeks. For context, just ten days earlier, on August 7, the same metric had reached its peak at 98.26%.
That’s a clear drop of nearly five percentage points, and it typically signals that fewer holders are sitting on massive unrealized gains.
 XRP price and percent supply in profit: Glassnode
This is important because when less of the network is in heavy profit, profit-taking slows. On August 5, a similar drop in this metric (94.75%) triggered a jump from $2.97 to $3.32 for XRP in just two sessions.
It repeated on August 11, when a dip to 94.37% preceded a rally from $3.13 to $3.27. With today’s levels near the fortnightly low, the setup for another short-term bounce is here.
For token TA and market updates: Want more token insights like this? Sign up for Editor Harsh Notariya’s Daily Crypto Newsletter here.
Short-Term Wallets Are Accumulating the Dip
Backing this up is wallet behavior. According to Glassnode’s HODL Waves, the 1-month to 3-month holding cohort has spiked notably after XRP hit its August low of $2.77.
 XRP price and HODL Waves: Glassnode
On August 1, the 1m–3m cohort made up just 5.81% of the XRP supply. By August 17, this jumped to 9.28%. This shift tells us that recent buyers are holding, not dumping — and they’re doing it despite volatility and the whale selling narrative.
This kind of behavior usually shows growing conviction. These short-term holders are stepping in during corrections, a pattern that tends to front-run trend reversals. The last time this group grew this quickly, XRP’s price saw sustained upward momentum within a week.
XRP Price’s Bullish Structure Still Intact, But Watch These Levels
Zooming out to the daily chart, the XRP price is still holding inside an ascending triangle — a bullish continuation pattern. Price is currently hovering around $2.96–$3.08, just above the triangle’s base.
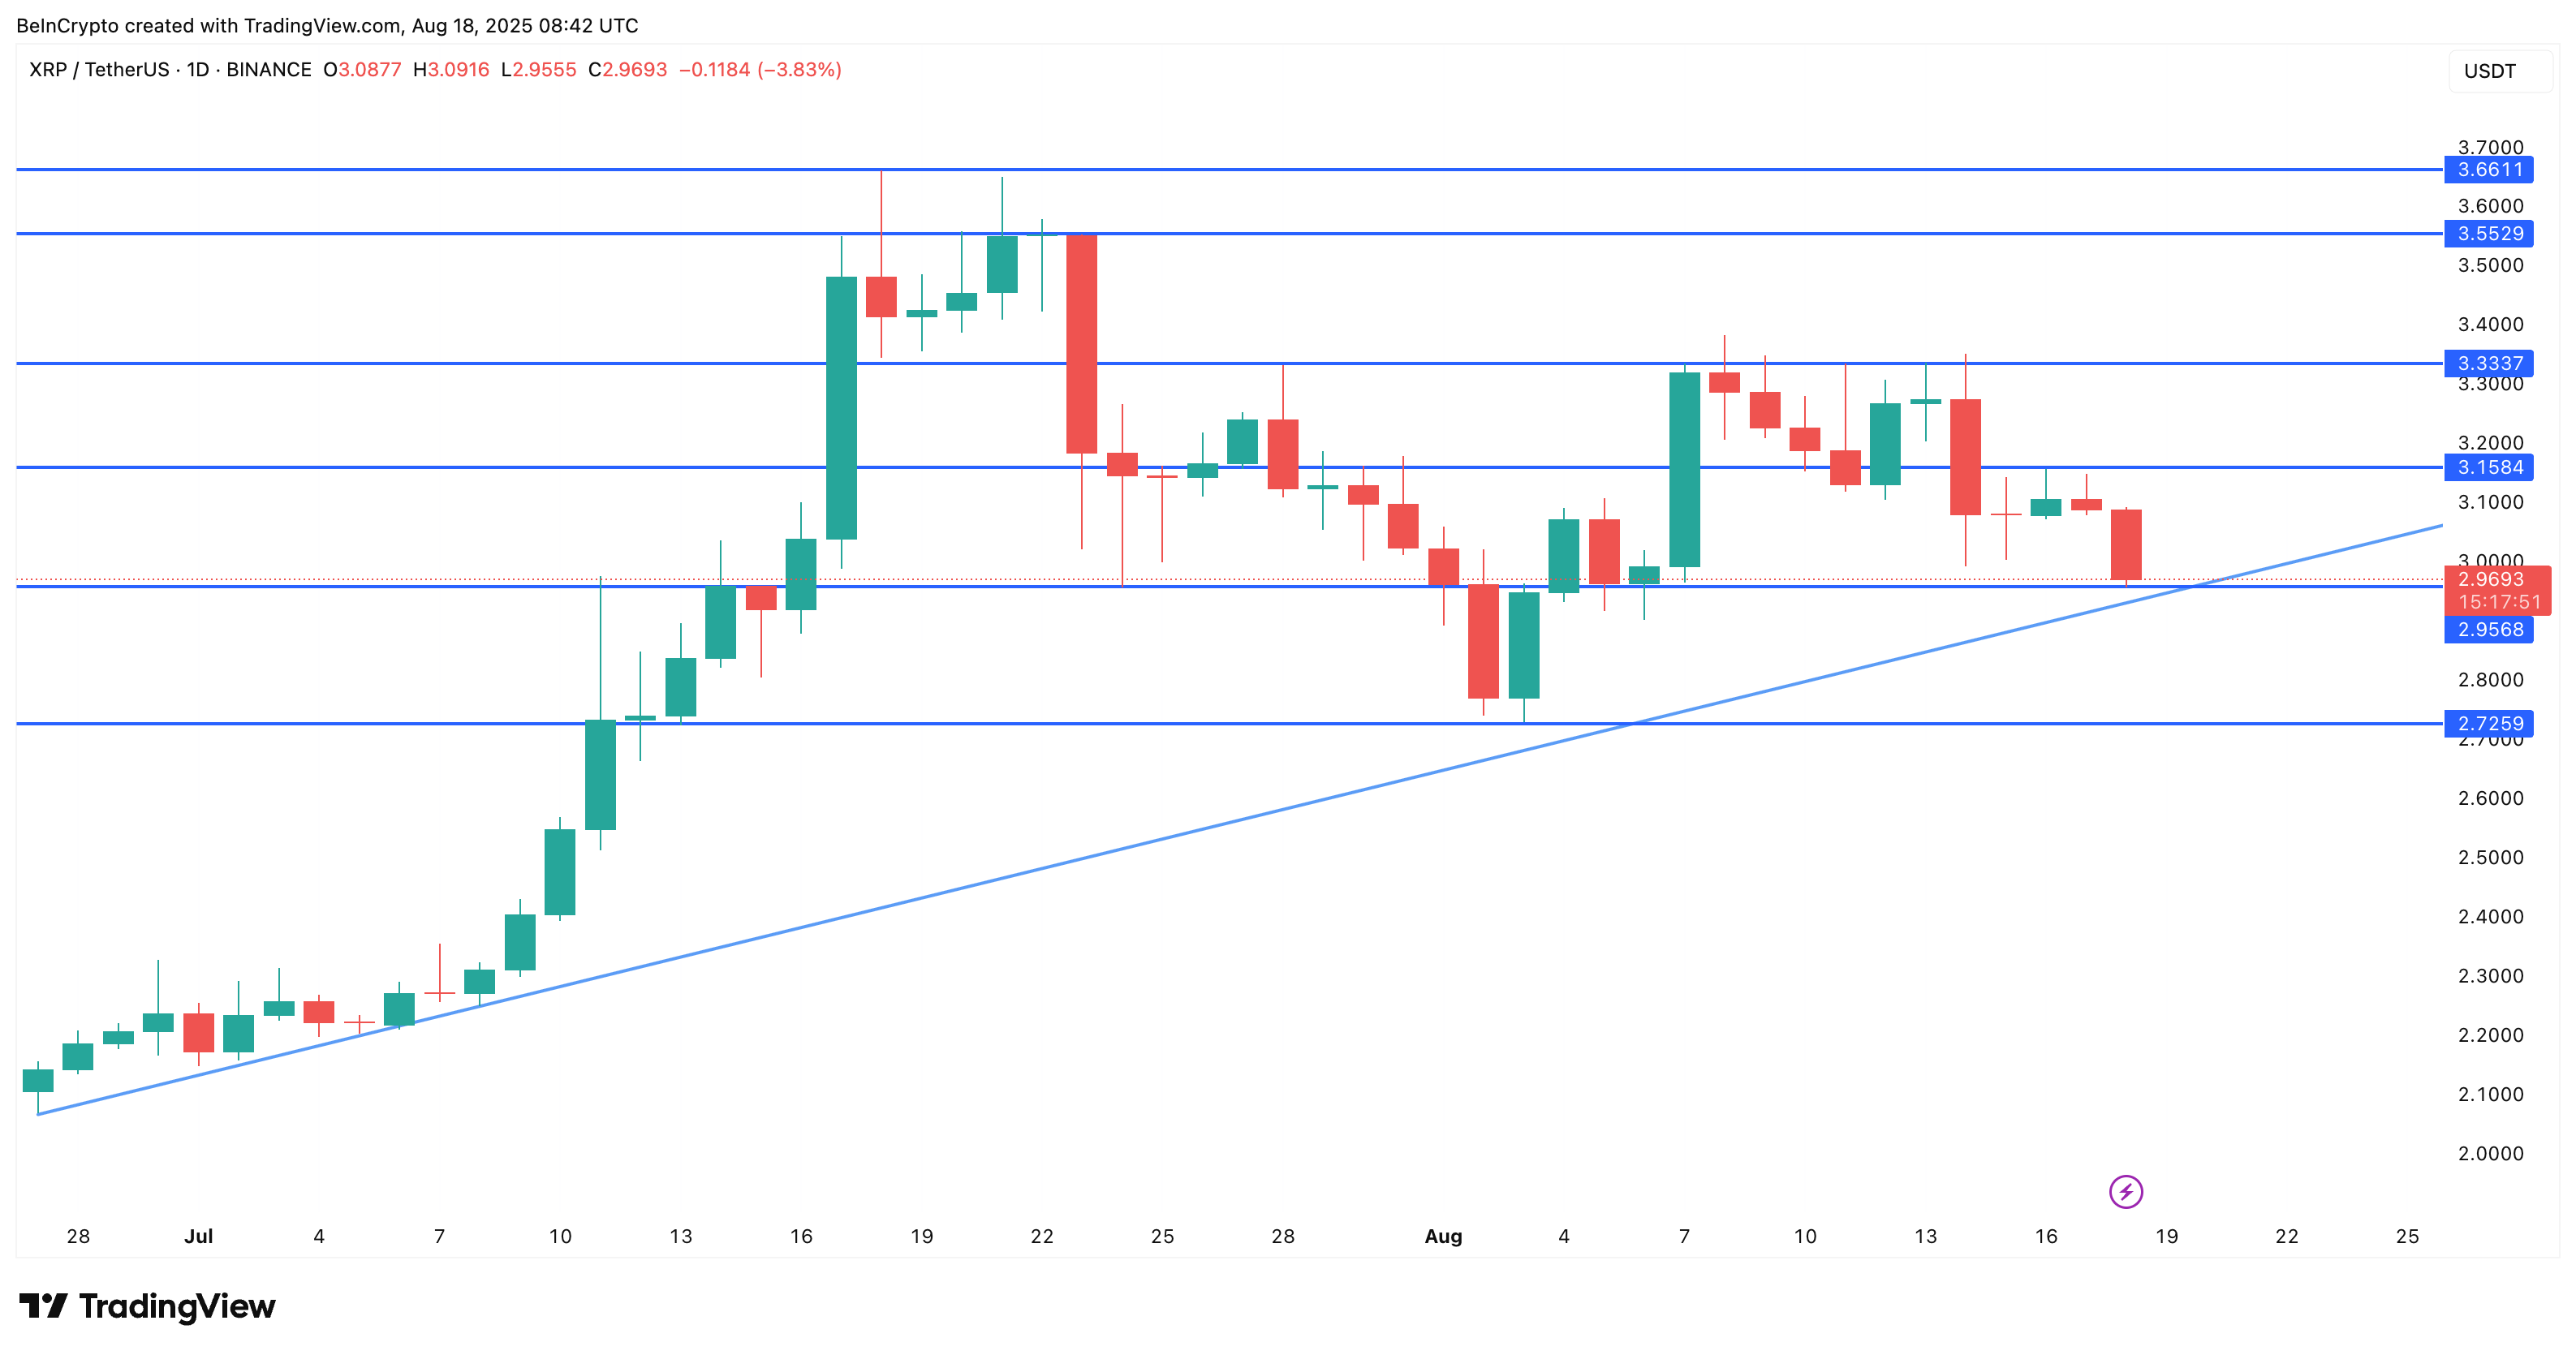 XRP price analysis: TradingView
Here are the key zones to watch:
- Resistance: $3.15, $3.33, $3.55, and $3.66
- Support: $2.95 (short-term), and $2.72 (final invalidation)
The $3.33 resistance level is easily the strongest, as the XRP price has been rejected at this level quite a few times over the past few days.
If XRP closes below $2.95, the ascending triangle risks a breakdown, but not a full bearish reversal until $2.72 breaks.
0
0


 Manage all your crypto, NFT and DeFi from one place
Securely connect the portfolio you’re using to start.

0
0

0
0


0
0