Ethena Explodes 23% Breaking Critical 50-Day Moving Average Barrier

0
0

- Ethena (ENA) bulls make a comeback as the price broke the 50-day EMA mark.
- ENA price surged by 23% in the last 24 hours, suggesting bullishness.
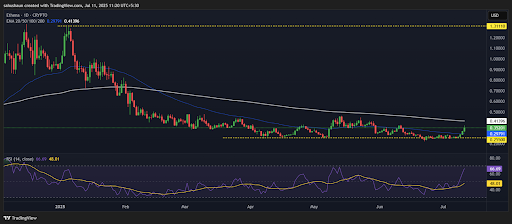
Ethena (ENA) has shown a strong bullish trend, surpassing its 50-day EMA mark at $0.29793 and currently aiming at the most important 200-day EMA resistance at $0.41397. The altcoin has made an impressive recovery since its extended consolidation period, and the price action has indicated the trend reversal after several months of sideways trading.
The 24-hour performance statistics of CoinMarketCap indicate the power of this breakout, as ENA has jumped 23% in the previous trading session. This significant price action is backed by equally impressive volume dynamics, with daily trading volume surging by 121%, which means that institutions and retailers are interested in the token. This surge in volume confirms the legitimacy of the present price action and indicates continued buying.
Technical indicators are becoming more and more bullish on several timeframes. Relative Strength Index (RSI) is at the current level of 67.18, which is in the positive momentum area but still not overbought at 70. This is an indication that there is more to come up before facing any major resistance by the momentum indicators. The trend of the RSI shows that it is gaining bullish momentum without any imminent fear of overextension.
What’s Next For Ethena (ENA) Price?
The MACD indicators also support the bullish perspective, as the histogram has turned green and the MACD curve is entering the positive zone. This defines the rally is genuine and often a sign of a long term price increase. The positive divergence of MACD also confirms that ENA is on a more positive stage of price discovery.
The sentiment analysis of social networks shows that the market perception is getting better, and more positive conversations are being made about the token. Such a basic background, coupled with the technical breakout, sets up a positive setting for further appreciation. Now, the 200-day EMA at $0.41397 is an important technical level that will define the next significant directional move. An upside breakout above this level would probably cause more buying pressure and even form a new uptrend.
The support level of $0.25500 is still intact and it is a strong support to any possible pullbacks. This level has held up well in the recent periods of consolidation and buyers are still coming in on any weakness. The technical configuration at present indicates that ENA is in a good position to keep on rising and the next significant challenge will be at the 200-day EMA resistance level.
Highlighted Crypto News Today:
Ethereum (ETH) Explodes Past Stagnation with an Over 8.5% Gain
0
0


 Manage all your crypto, NFT and DeFi from one place
Securely connect the portfolio you’re using to start.


0
0

0
0

0
0