Ethereum Price Pattern Hints at 20% Rally Amid Rising Leverage Risk

0
0

Ethereum price is trading near $2,260 at press time after climbing roughly 15% over the past seven days. The rally follows a steady recovery from February lows and has now pushed the asset toward a major technical resistance zone.
A bullish price structure forming on the 12-hour chart suggests Ethereum could be preparing for a larger move. However, several on-chain and derivatives indicators show both supportive signals and potential risks.
Bullish Ethereum Price Structure Suggests a 20% Upside
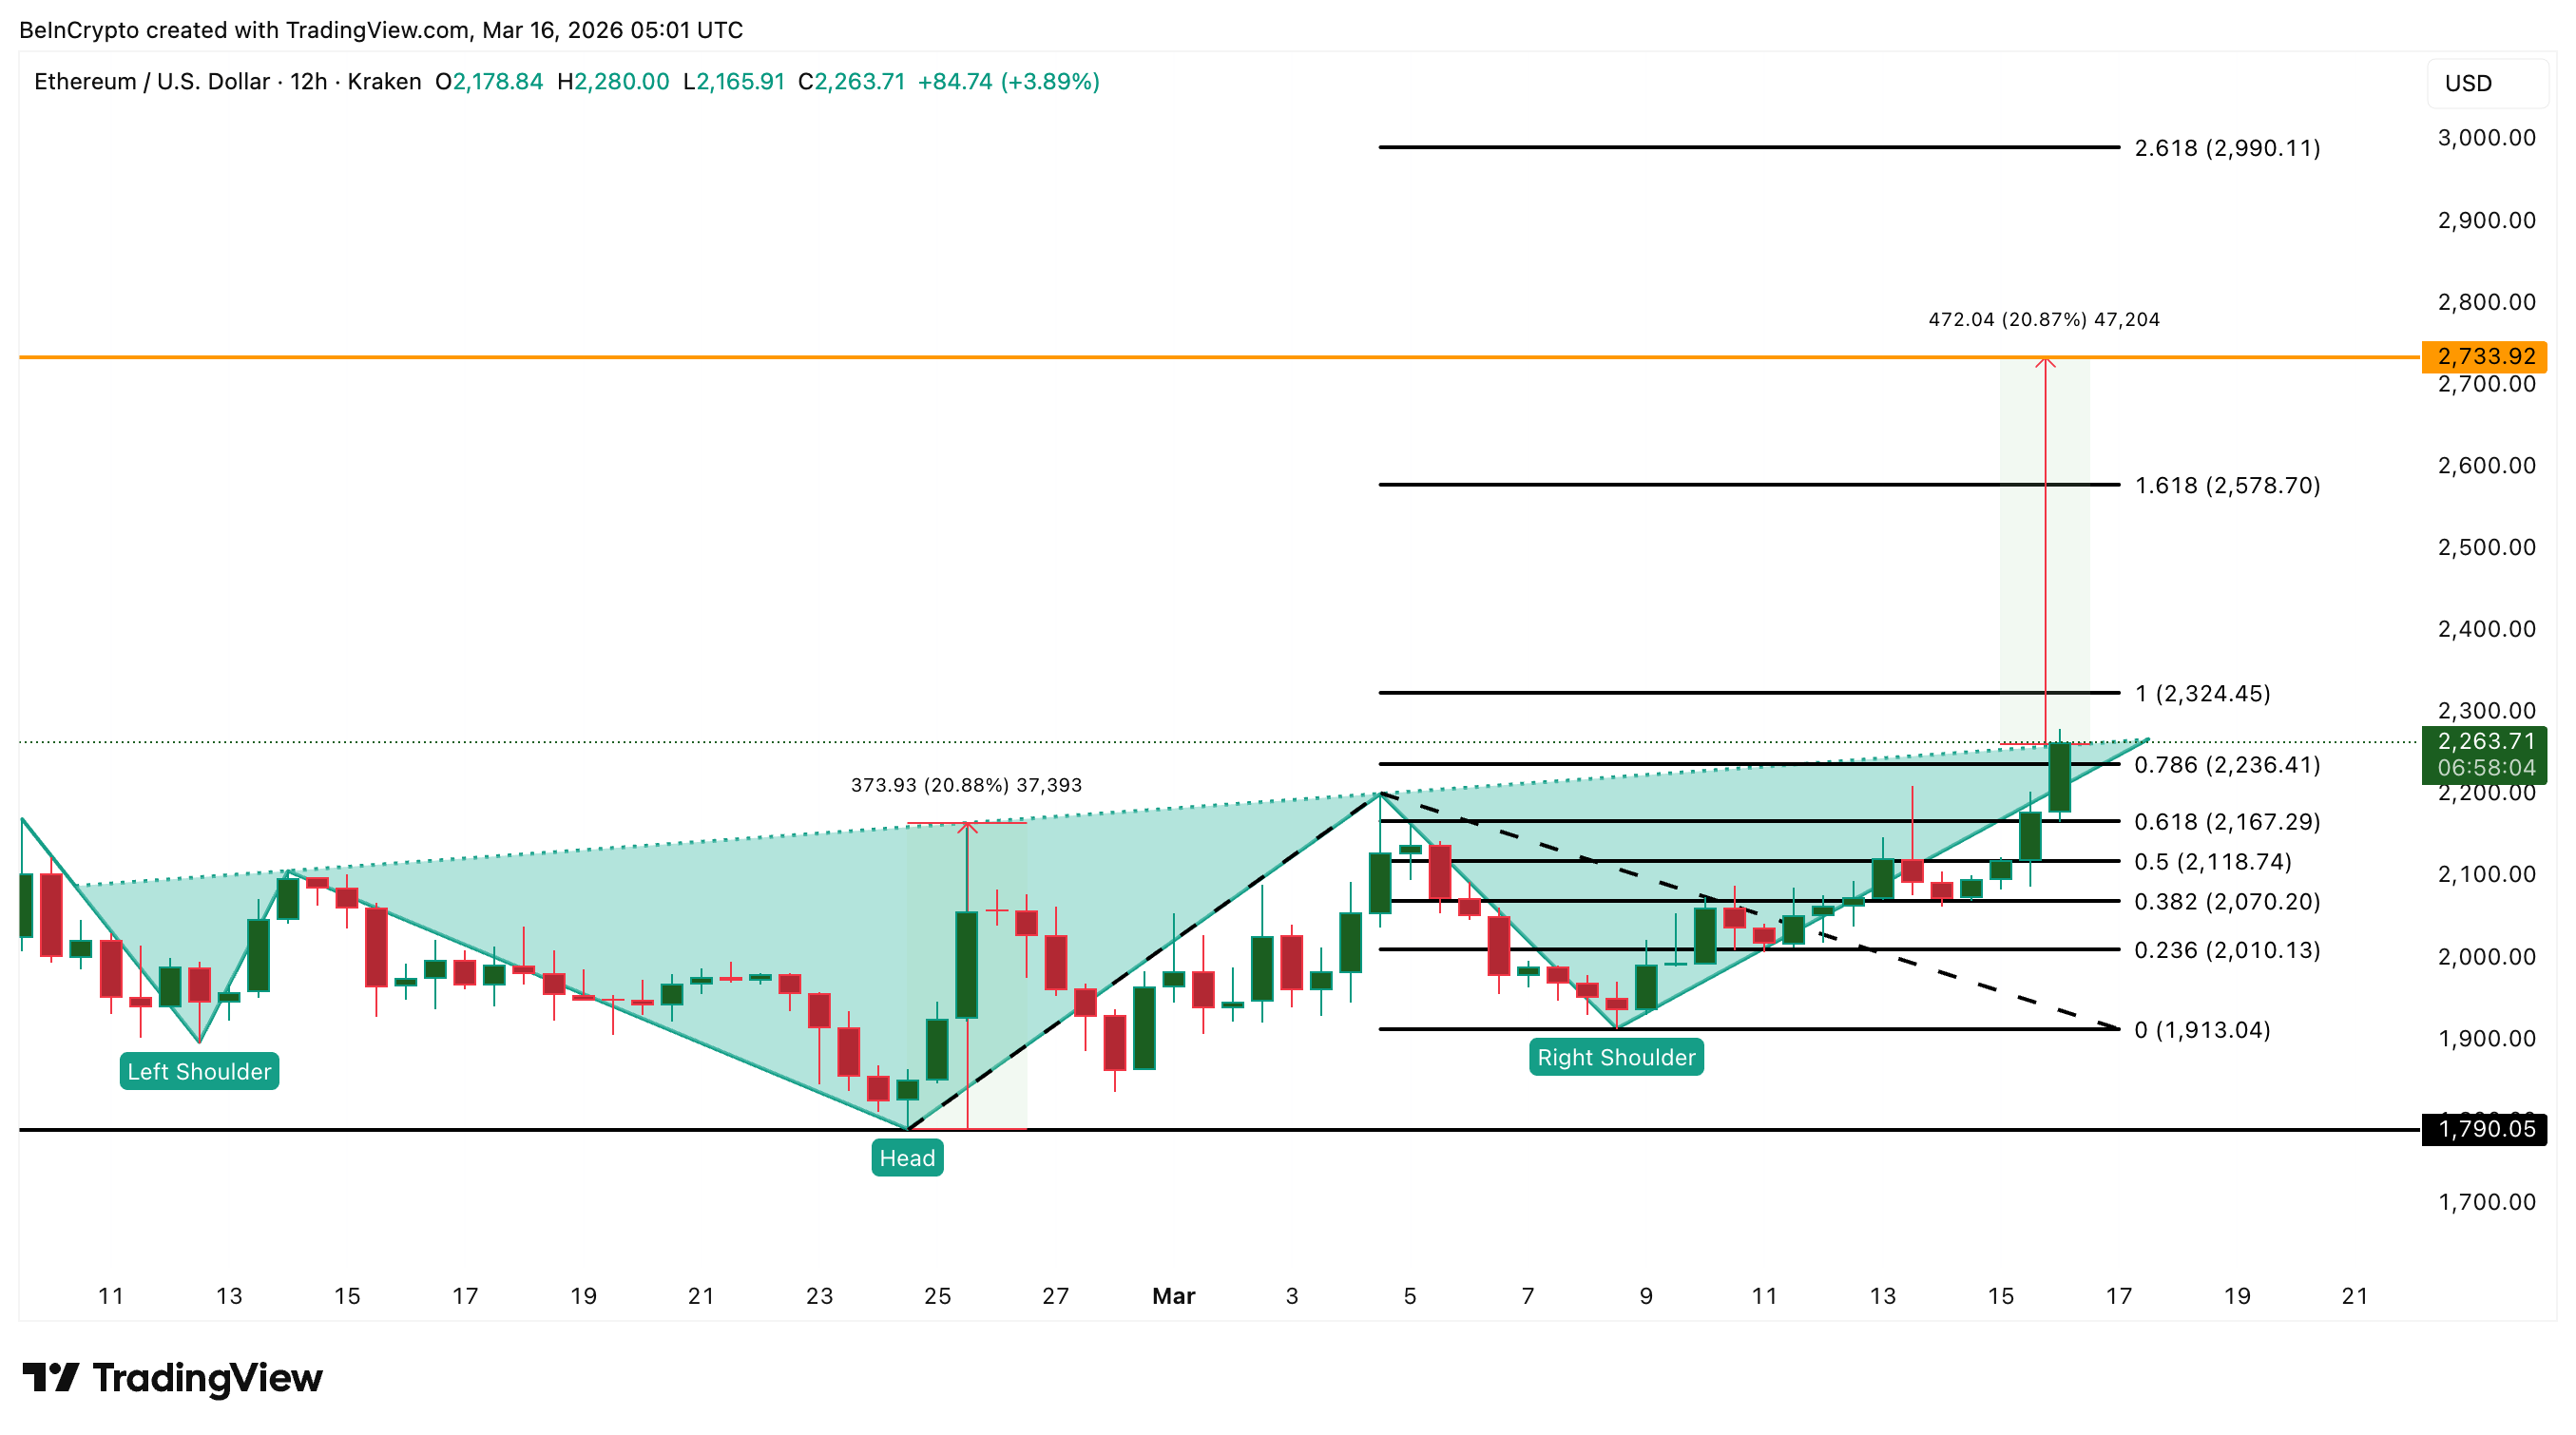
The 12-hour chart shows Ethereum forming an inverse head-and-shoulders pattern, a structure traders often interpret as a bullish reversal setup.
If the price breaks and holds above the pattern’s neckline, the pattern’s measured move targets roughly a 20% rally.
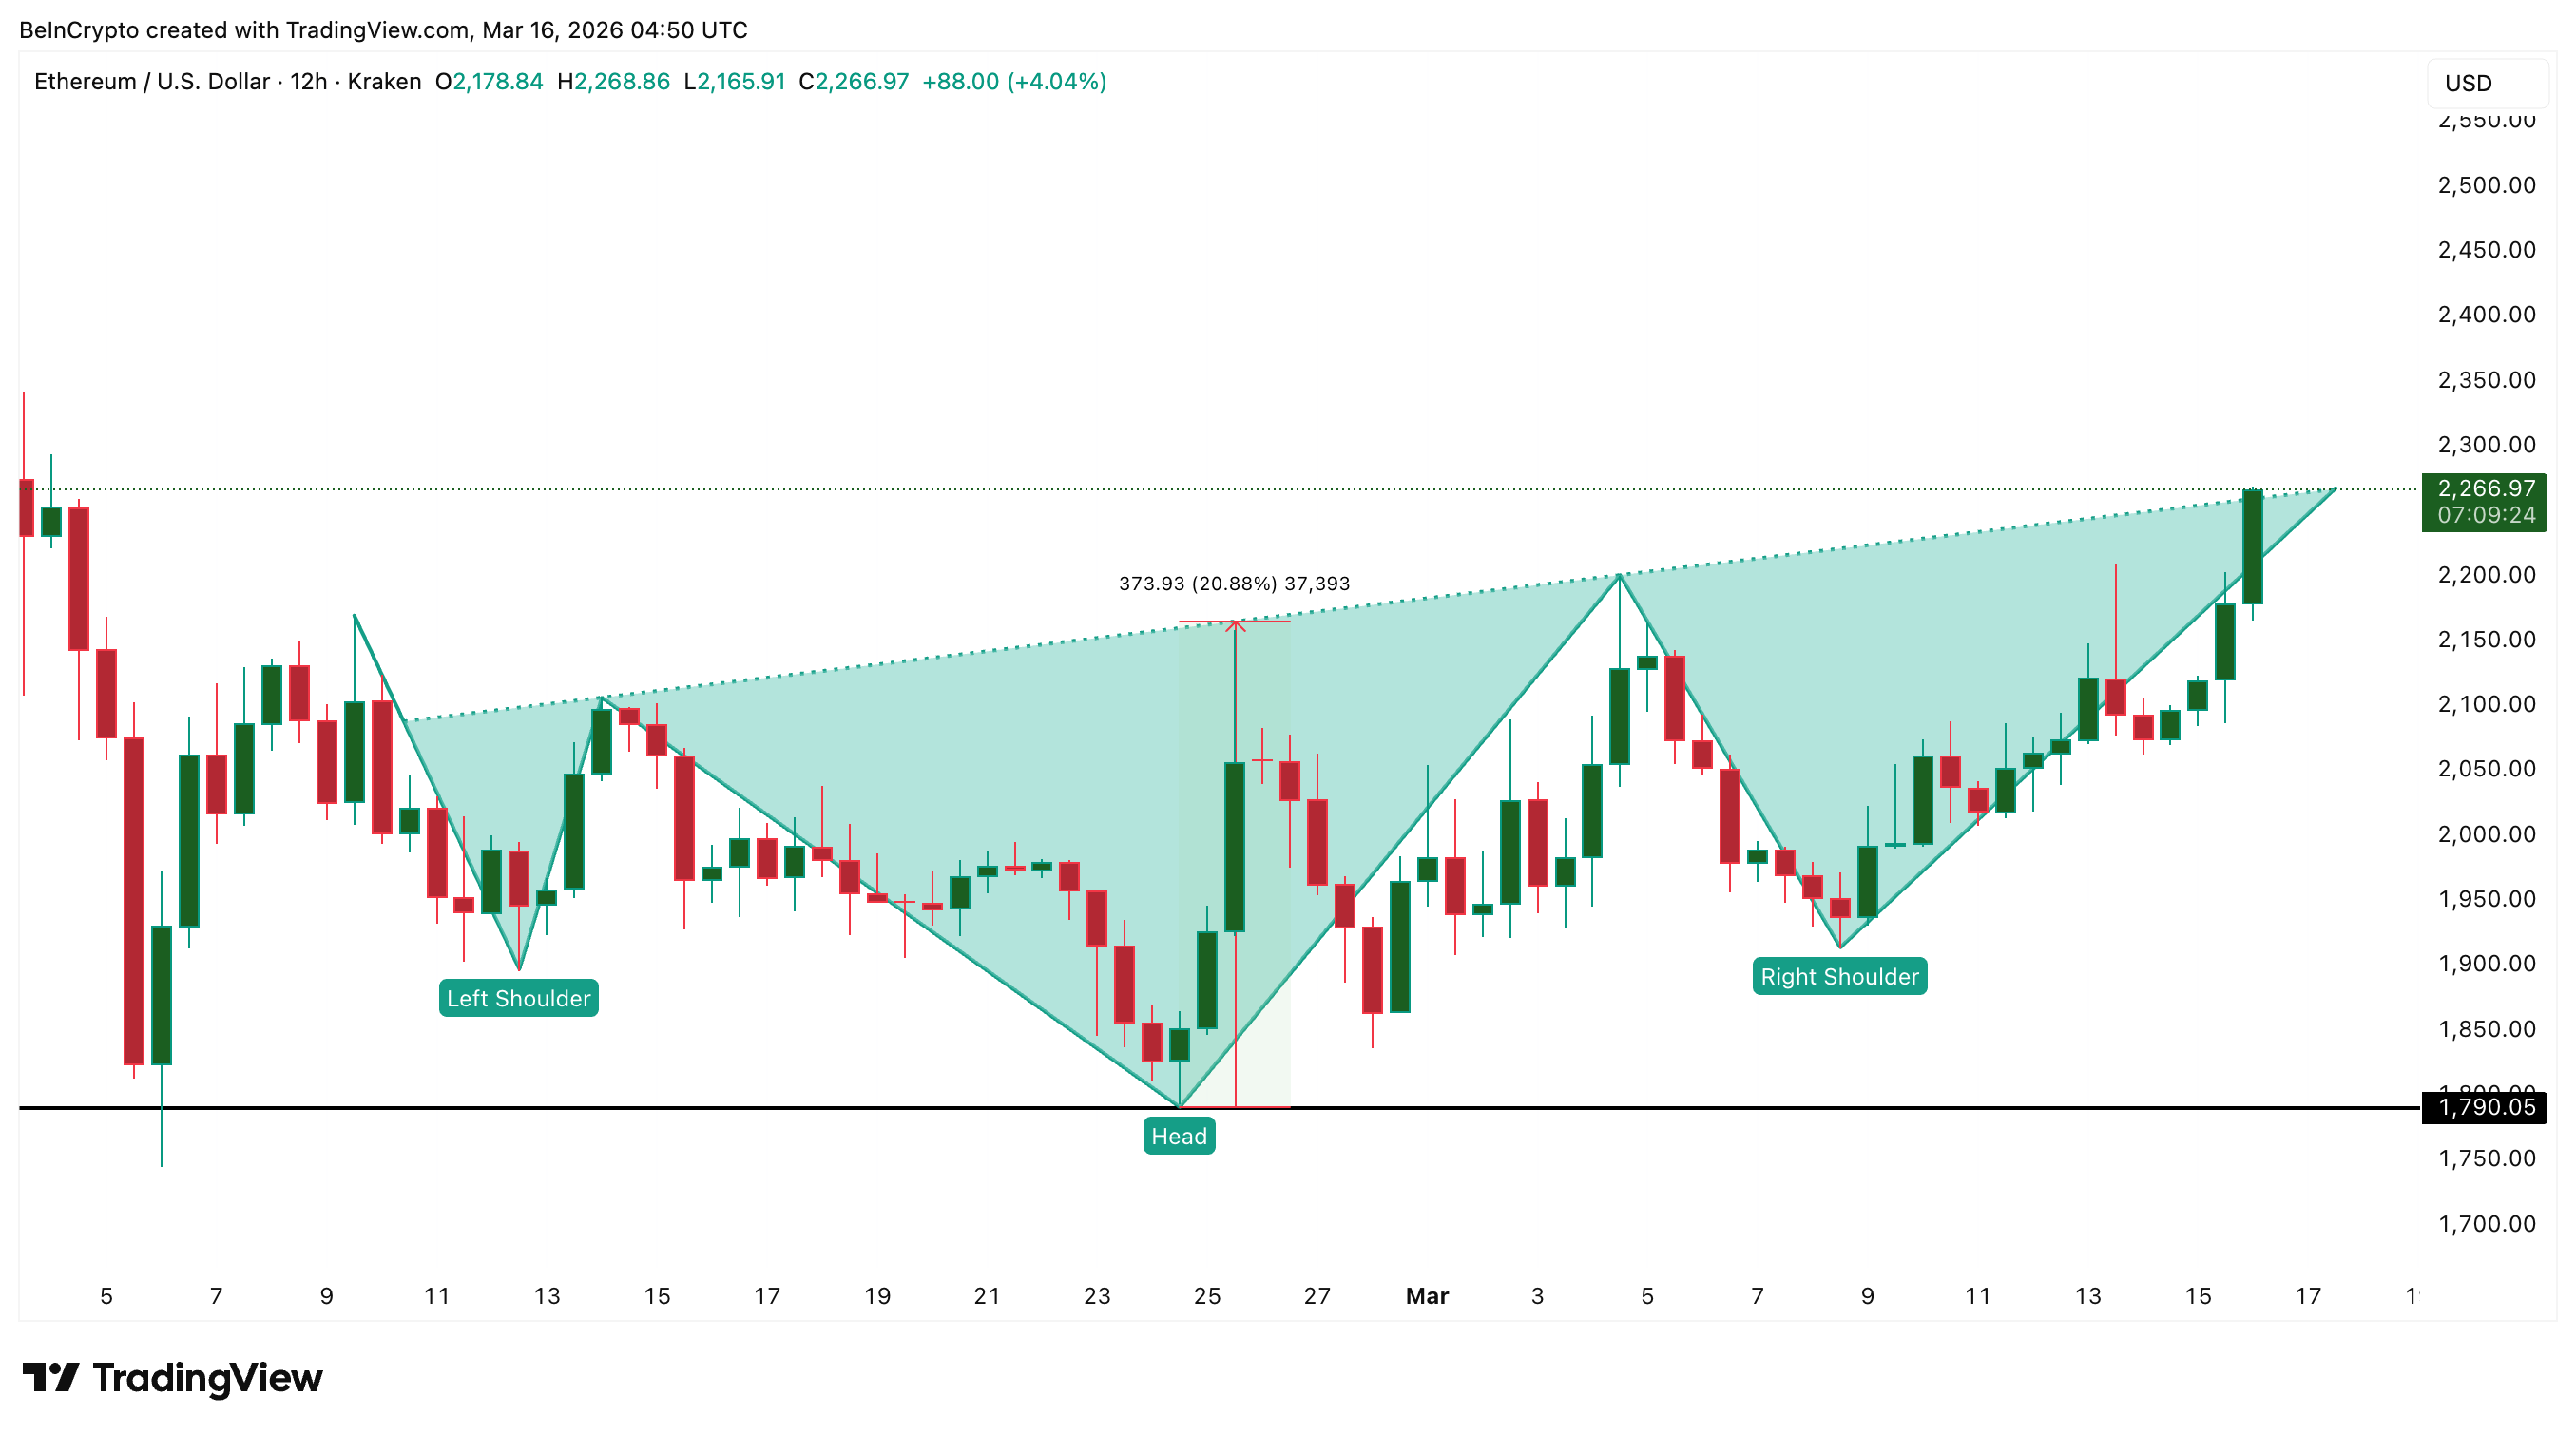 ETH Price Structure: TradingView
Ethereum has already moved sharply toward this neckline after rebounding from the right-shoulder zone and seems to have crossed it at press time. However, breakouts from chart patterns do not always succeed. Some fail when investors begin locking in profits or when leveraged traders crowd into the same position.
That makes it important to evaluate how holders across the network are currently behaving.
Ethereum Profitability Turns Positive as Long-Term Holders Accumulate
One indicator that helps explain broader investor sentiment is Net Unrealized Profit/Loss, commonly called NUPL.
NUPL measures whether the average Ethereum holder is sitting in profit or loss. When the metric turns positive, it means investors are holding coins at unrealized profits. Historically, this can increase the chance of selling pressure because traders may choose to secure gains.
Ethereum’s NUPL remained negative for much of February. On February 5, the metric dropped to around –0.21, signaling deep capitulation, with most investors holding coins at a loss.
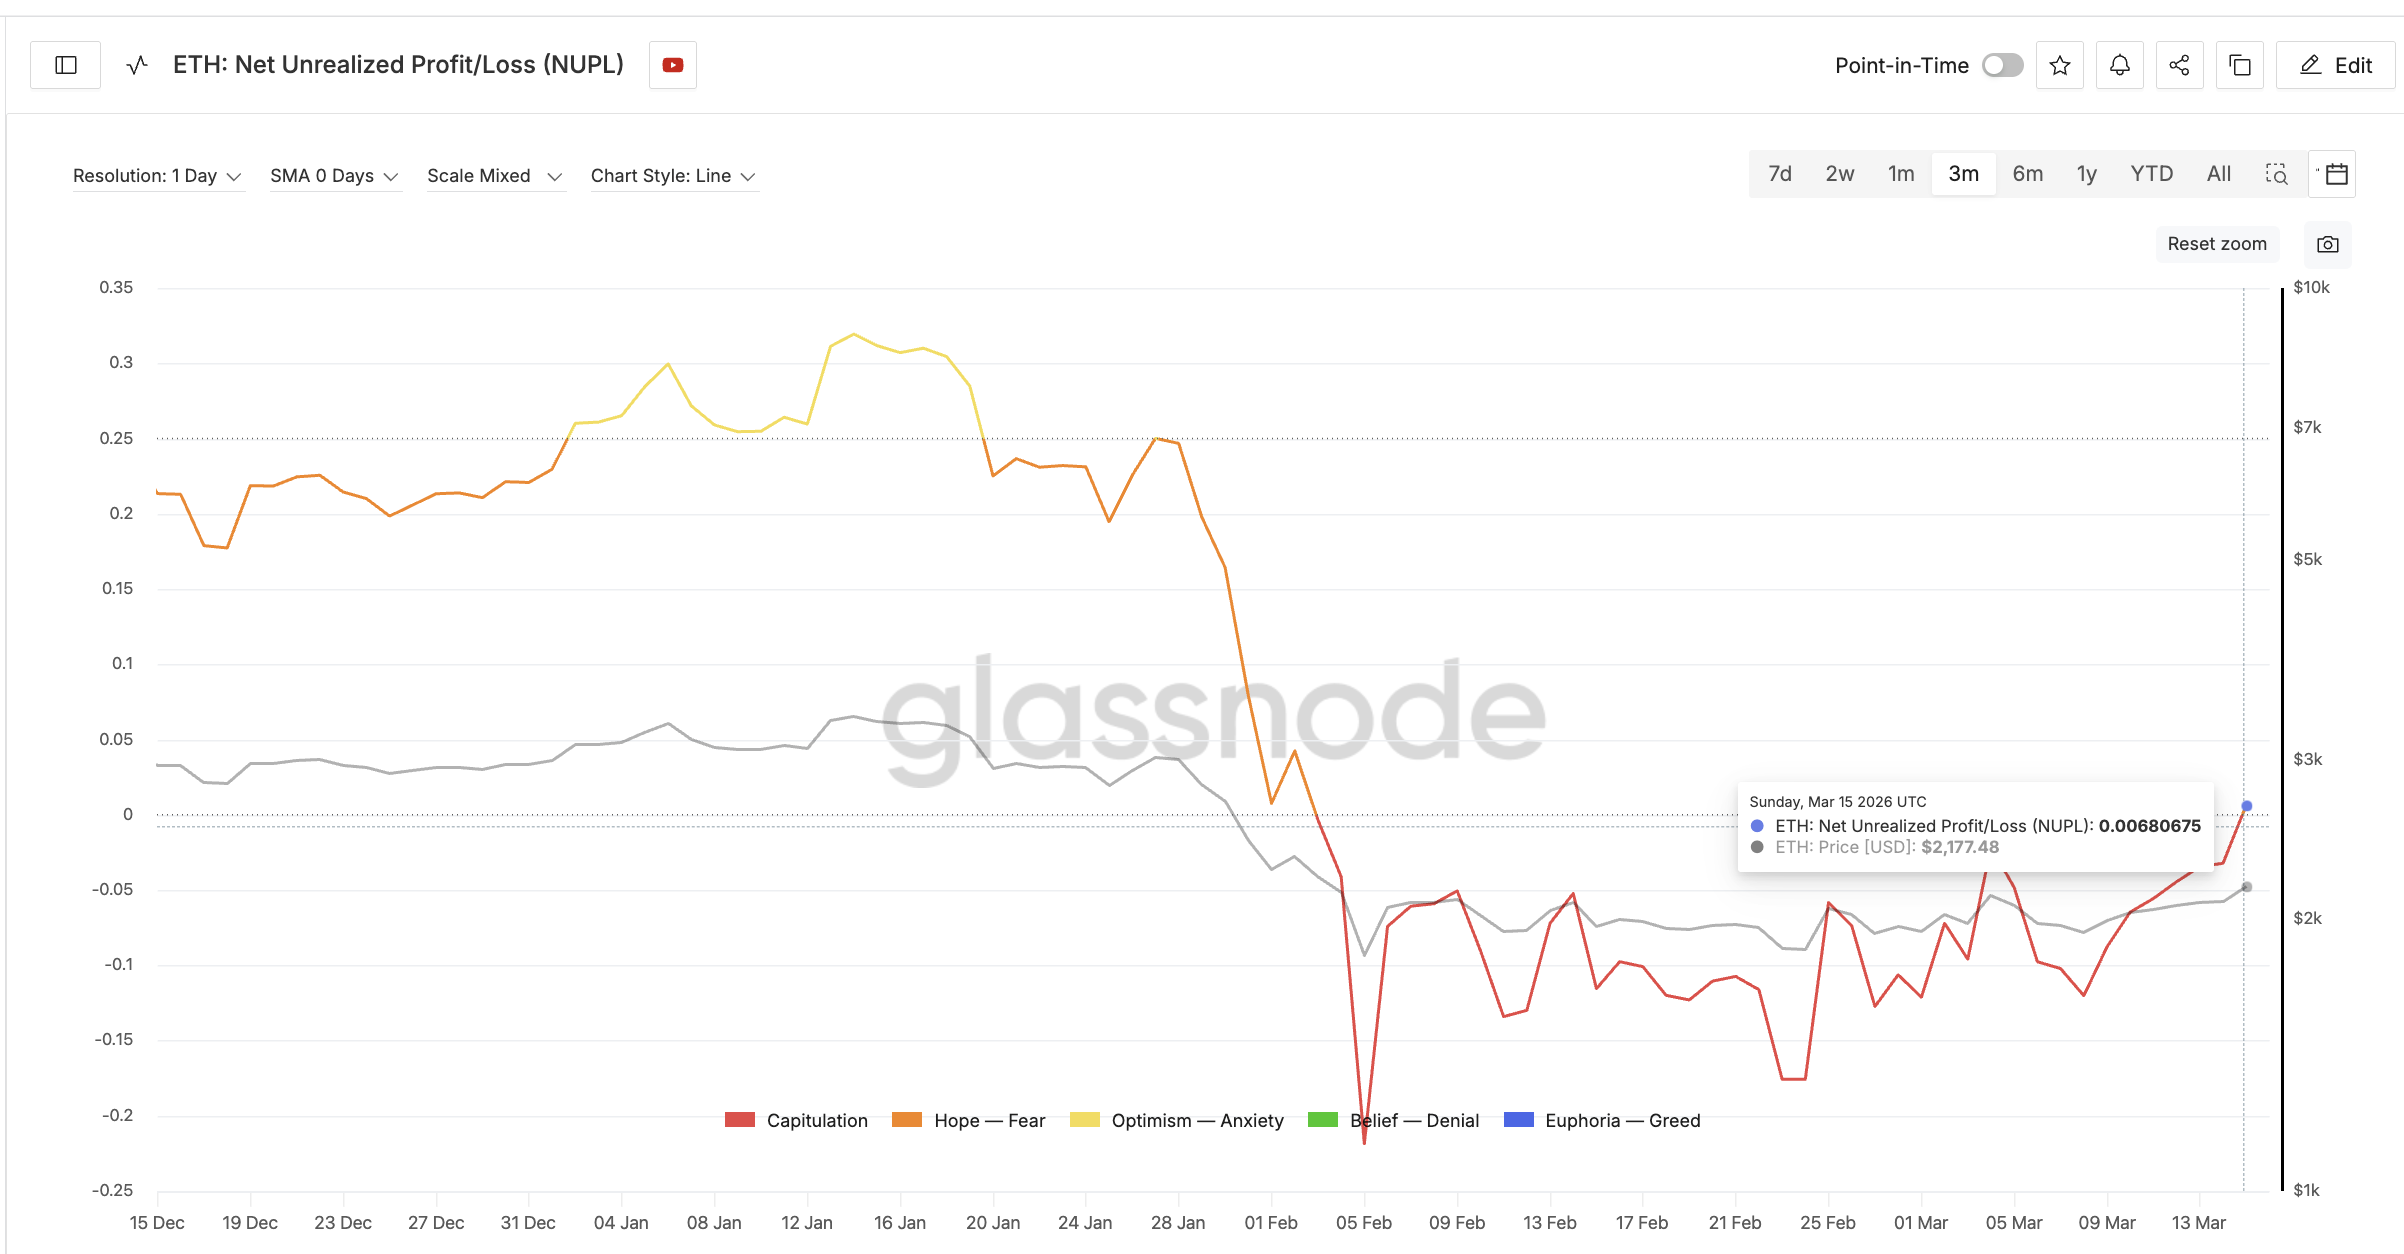 Paper Profits/Loss: Glassnode
Recently, the metric climbed back into positive territory and now sits around 0.006 (first time since the last positive value on February 2). This shift indicates the market has moved from capitulation into the early “hope-fear” stage, where profits begin to reappear across the network.
Normally, rising profits could encourage investors to sell if the rally lacks conviction. But that risk depends heavily on whether long-term holders are distributing or accumulating their positions: a measure of conviction or lack thereof.
The Hodler Net Position Change metric provides insight into that behavior. This indicator tracks the 30-day rolling change in coins held by long-term investors.
On February 24, long-term holders were adding roughly 9,454 ETH. Since then, accumulation has accelerated dramatically. By mid-March, the metric climbed to around 523,513 ETH.
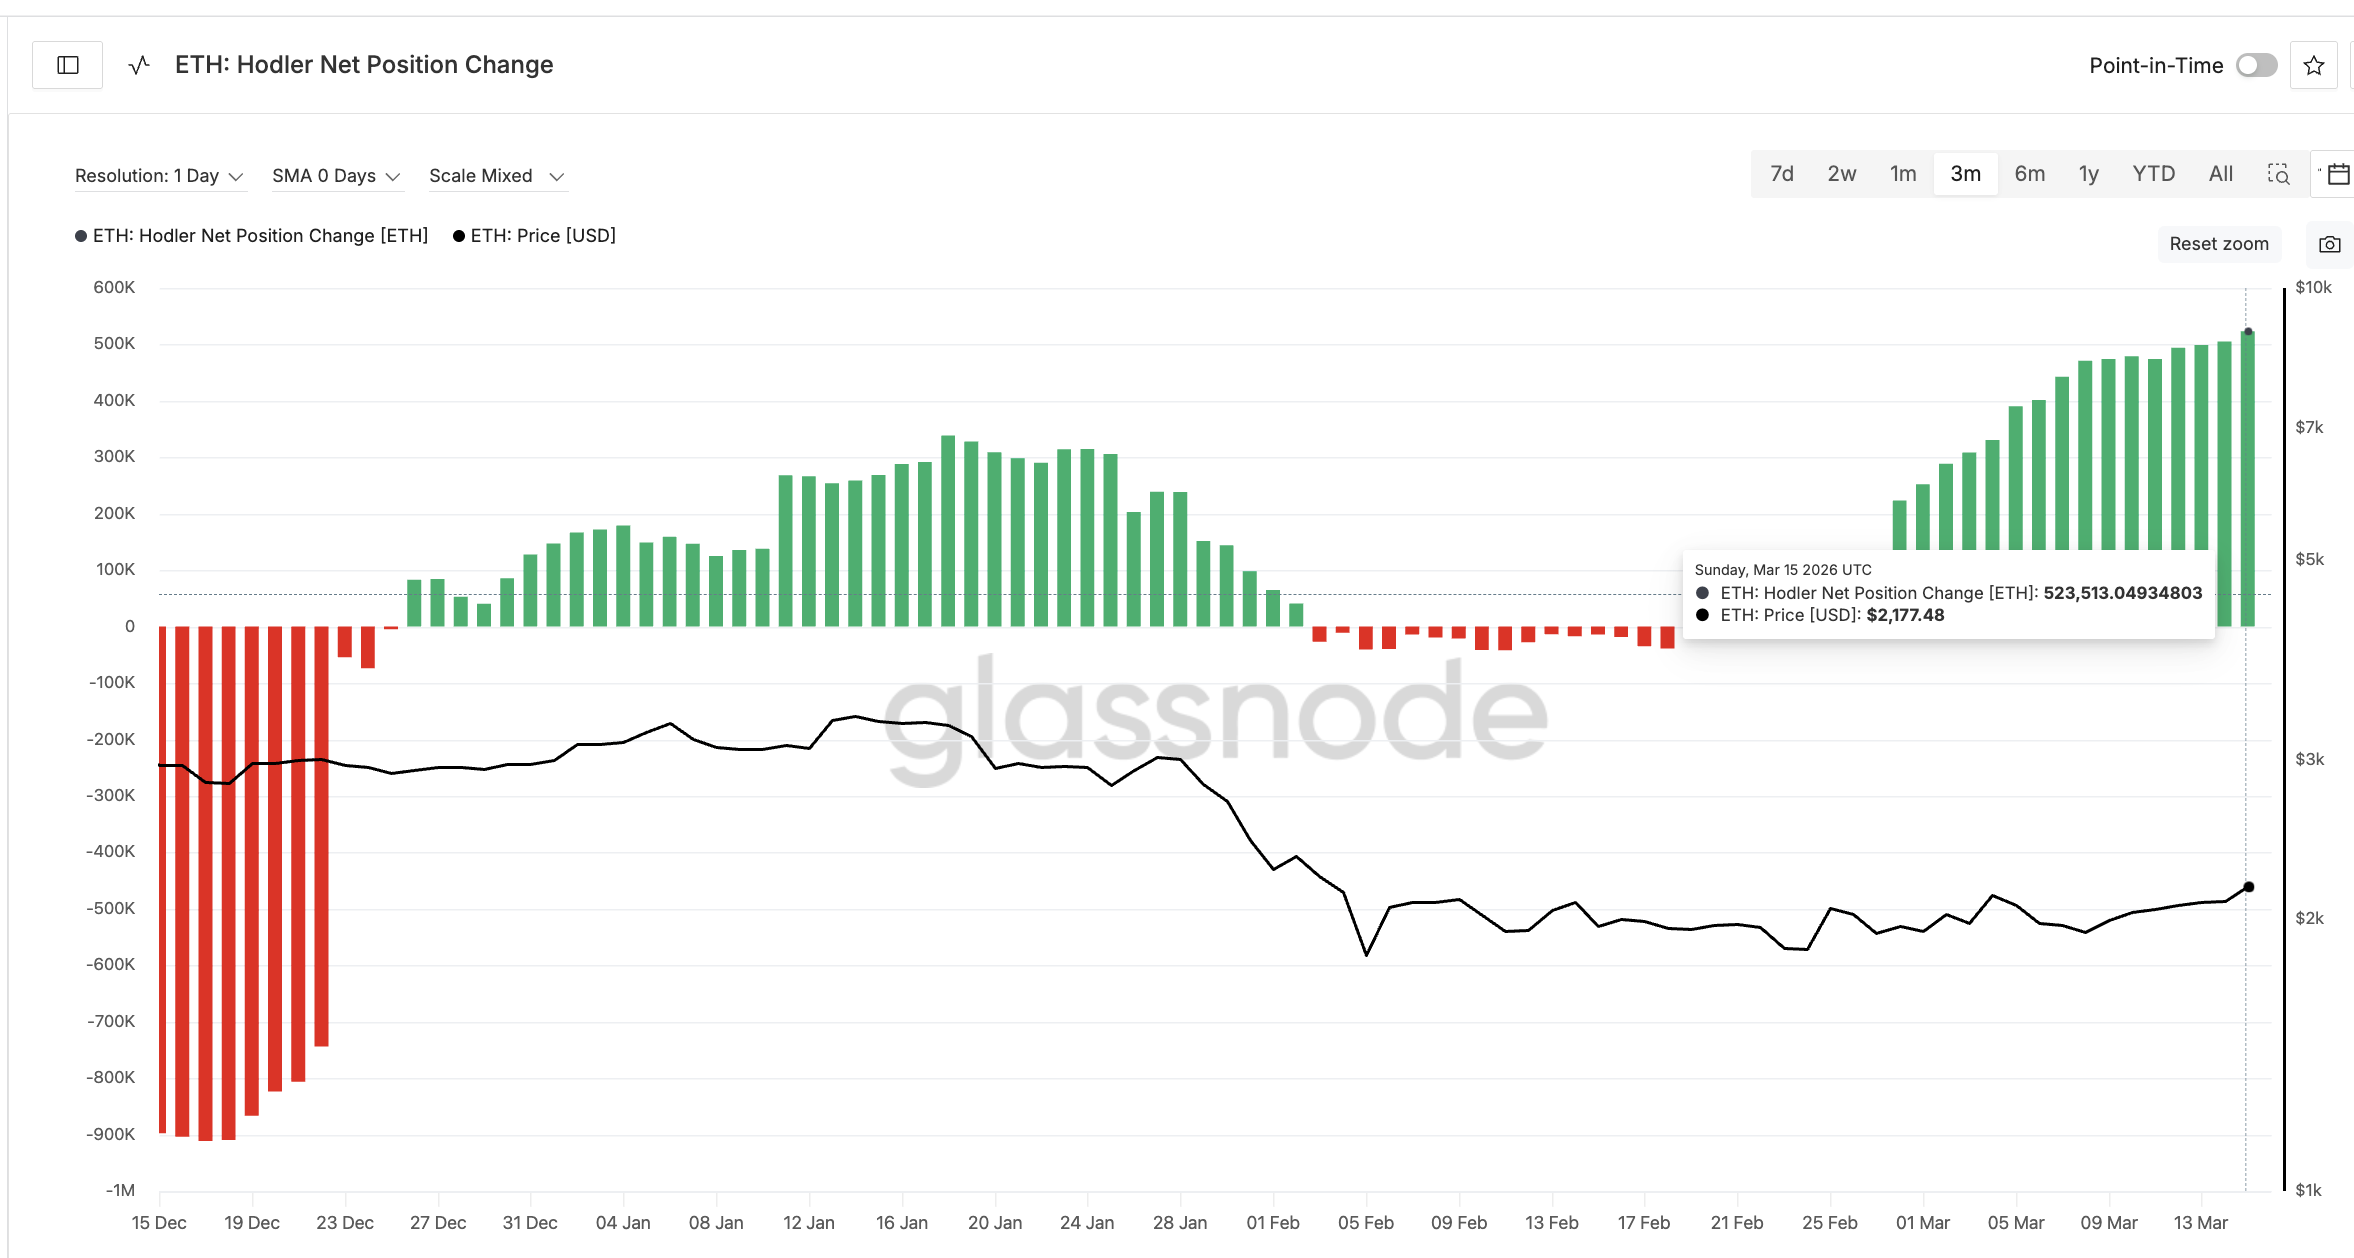 ETH Hodlers: Glassnode
This represents an increase of more than 5,400% in net accumulation. Such a sharp shift suggests long-term investors have regained confidence and are adding to their positions during the rally rather than reducing exposure. The NUPL capitulation in early February didn’t have this backing. At that time, Hodlers became net sellers.
When long-term holders accumulate while profitability rises, it often signals that investors expect higher prices ahead. However, spot accumulation alone cannot sustain rallies if derivatives markets become overheated.
Rising Leverage Adds Risk as Whale Accumulation Strengthens
Ethereum’s derivatives market shows that leverage has increased during the latest price move.
Open interest (OI), which tracks the total value of active futures contracts, rose from roughly $9.42 billion on March 9 to about $11.75 billion recently. That represents an increase of approximately 25%. Even the funding rate is now positive at 0.009 as compared to early March.
Rising OI with positive funding suggests traders are adding long leveraged positions. That can create a long-squeeze risk if the ETH price corrects even slightly.
At the same time, large Ethereum holders have been expanding their positions.
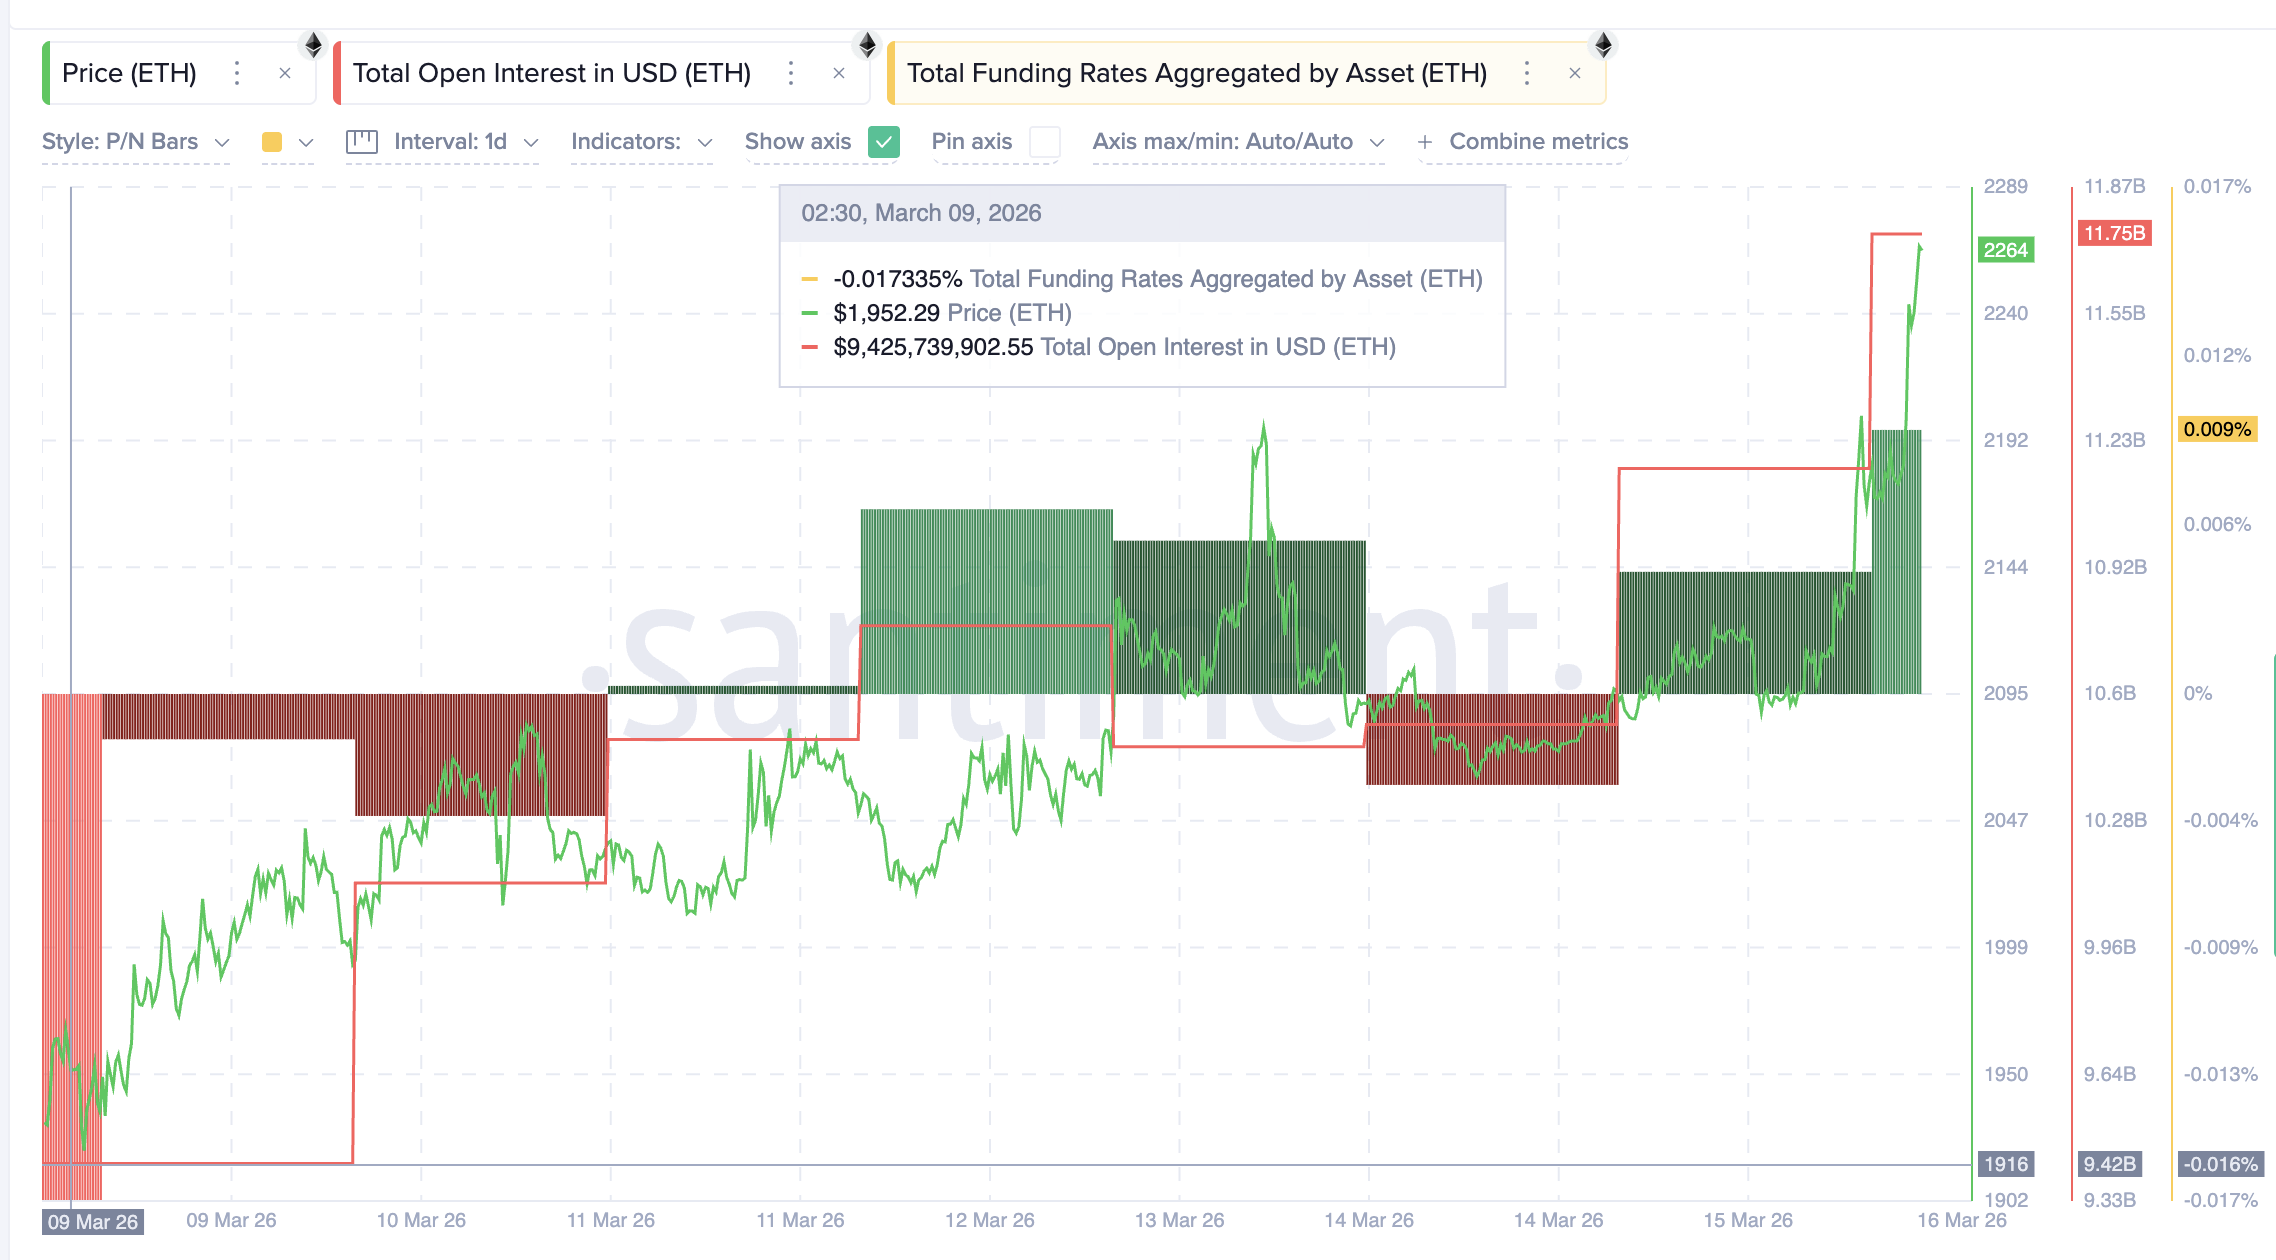 Funding Rates And OI: Santiment
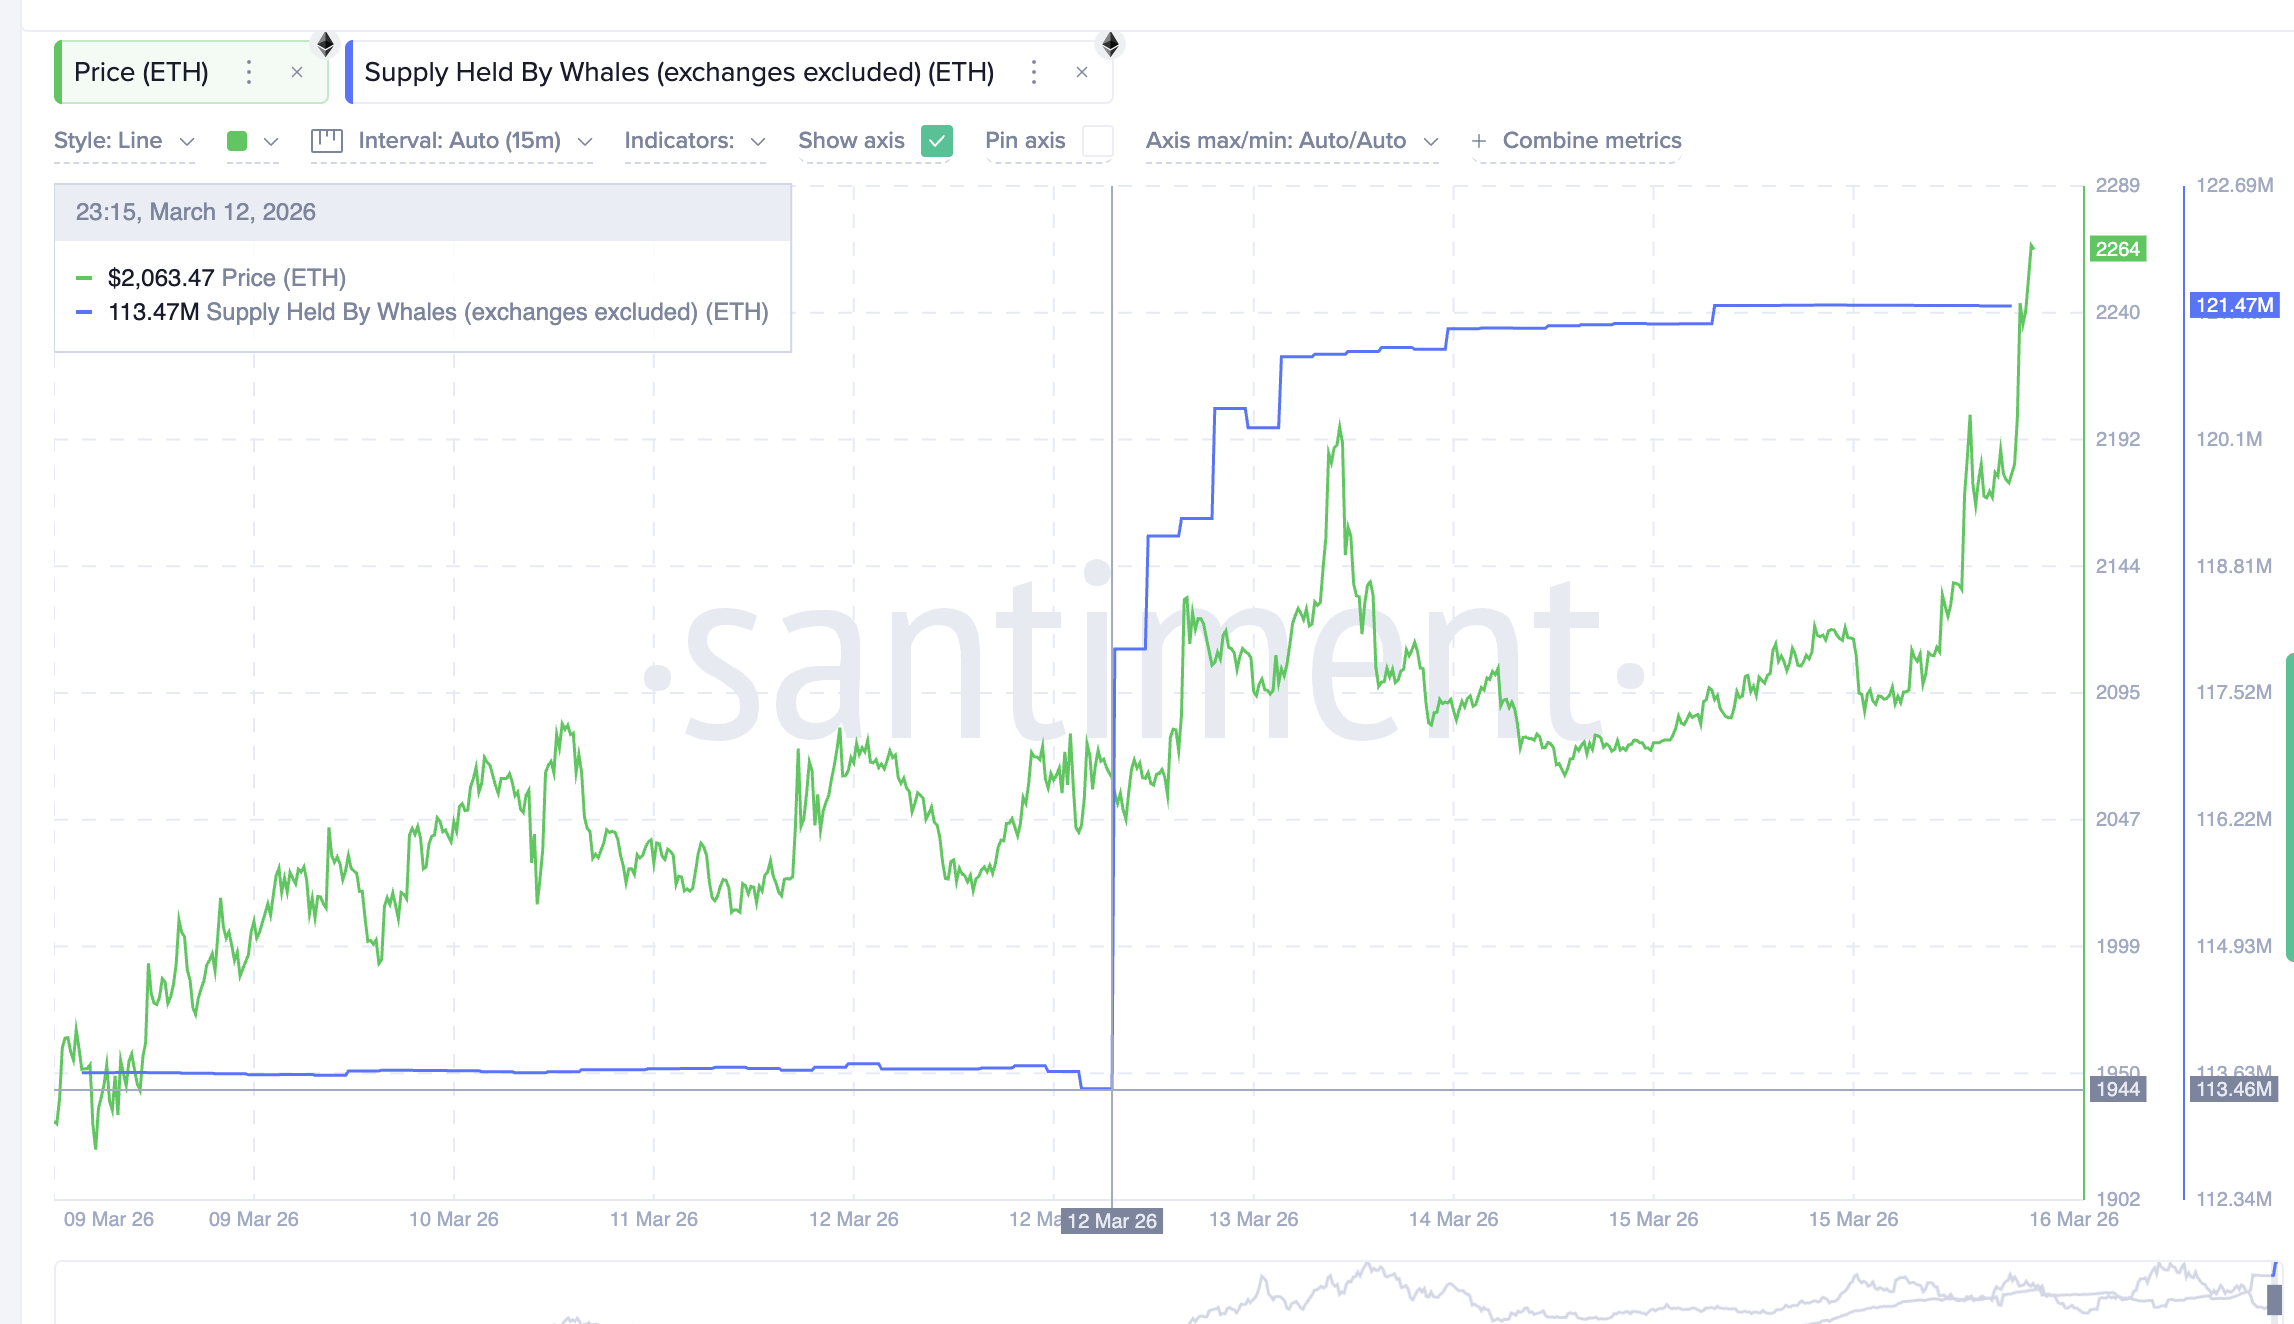
On-chain data shows that whale wallets increased their holdings from about 113.46 million ETH on March 12 to roughly 121.47 million ETH recently. This represents an increase of approximately 8.01 million ETH.
 ETH Whales: Santiment
At current prices, that additional supply equals roughly $18 billion worth of Ethereum. However, some recent whale activity introduces an additional nuance. A large transaction recently moved 20,000 ETH, valued at roughly $44.9 million, from a standard Coinbase wallet into Coinbase Prime infrastructure.
Importantly, the whale supply metric used in our analysis tracks supply held by whales, excluding exchange wallets. This means the data measures balances in large private wallets rather than coins held on trading platforms.
As a result, institutional transfers into Coinbase Prime do not directly alter the whale supply metric. The accumulation trend shown by this indicator, therefore, reflects a broader increase in holdings outside exchanges, independent of institutional infrastructure movements.
Together, these signals suggest that while long leverage has increased, spot demand from large holders continues supporting Ethereum’s recovery.
Ethereum Price Levels That Could Decide the Next Move
Ethereum now sits at a key technical crossroads.
The first level to watch is the neckline resistance, followed by a technical hurdle at $2,320. A sustained move above that level would confirm the strength behind the inverse head-and-shoulders breakout.
If Ethereum clears this resistance, the next major level appears around $2,570. Breaking that zone could open the path toward the pattern’s projected target near $2,730. If bullish momentum remains strong, Ethereum could even extend its move toward the $2,990 region in the short term.
 Ethereum Price Analysis: TradingView
However, downside risks still exist if leverage begins unwinding or if investors start locking in profits. The first important support level sits near $2,160, which aligns with the 0.618 Fibonacci retracement level. Additional support appears around $2,070.
A deeper decline toward $1,910 would weaken the bullish pattern and suggest the inverse head-and-shoulders structure may fail.
For now, Ethereum’s price structure points to a potential upside breakout. But whether the 20% rally materializes will depend on whether strong holder conviction and whale demand can absorb volatility from rising leverage.
0
0


 Manage all your crypto, NFT and DeFi from one place
Securely connect the portfolio you’re using to start.

0
0

0
0

0
0
