
Solana App Revenue Doubles Robinhood Chain as SOL Holds Above $100

0
0
What to Know
- Solana applications generated $6.56 million in 24-hour revenue, more than doubling Robinhood Chain and outperforming several major blockchain ecosystems globally.
- Hyperliquid surpassed Ethereum in application revenue, while Base remained outside the five highest-ranked networks during the measured period entirely.
- SOL recovered from $62 and held above $100, while technical resistance between $108 and $110 limited further upward price gains.
Solana applications generated approximately $6.56 million within 24 hours, placing the network above several prominent blockchain ecosystems. This performance more than doubled Robinhood Chain’s $3.22 million, highlighting Solana’s stronger application revenue during the measured period.
According to the latest network ranking, BNB Smart Chain secured second place with approximately $3.26 million. Robinhood Chain followed narrowly behind, although both networks remained significantly below Solana’s total.
Moreover, Hyperliquid L1 applications produced around $1.94 million, allowing the network to surpass Ethereum during the same reporting period. Ethereum generated $1.59 million, while Base missed the top five.
Application revenue measures income earned by protocols operating across each blockchain. Therefore, the figures offer a useful indication of demand and monetization across decentralized applications.
Solana’s commanding advantage suggests its applications converted network activity into revenue more effectively than competing platforms. However, one day of data cannot establish whether the network can maintain this lead over longer periods.
Also Read: BIS Tests XRPL to Verify Official Economic Statistics and Prevent Data Tampering
SOL Recovery Builds Above Key Technical Levels
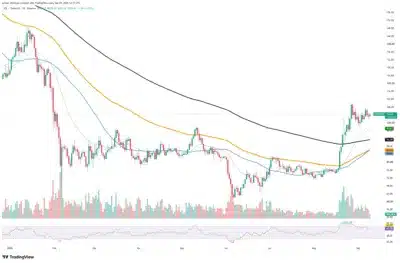
Solana’s revenue performance coincides with SOL’s recovery from its June low near $62 to approximately $104.40. Buyers regained control during August when the token escaped a consolidation range between $74 and $78. Consequently, SOL crossed several major moving averages as momentum strengthened. The token trades above its 20-day moving average near $97.07, reinforcing the recovery beyond $100.
Additionally, SOL remains above the 200-day moving average around $91.38, supporting its market structure. Its 50-day and 100-day averages have gathered near $86, creating another support zone during a deeper correction.
Source: Tradingview
Momentum has moderated since August, with the Relative Strength Index retreating from overbought territory to approximately 63. Trading volume has also declined while SOL consolidates between $100 and $108.
A confirmed breakout above the $108 to $110 resistance range could support an advance toward $116 and possibly $120. Conversely, losing the $100 support could expose the rising 20-day average near $97.
Application revenue does not directly determine SOL’s valuation because both metrics reflect different aspects of the ecosystem. Nevertheless, Solana’s revenue leadership demonstrates substantial economic activity while SOL attempts to establish support above $100.
Also Read: Bitcoin Nears $80,000 as Large Exchange Deposits Remain Within Normal Range
The post Solana App Revenue Doubles Robinhood Chain as SOL Holds Above $100 appeared first on 36Crypto.
0
0


 Manage all your crypto, NFT and DeFi from one place
Securely connect the portfolio you’re using to start.


