Hyperliquid (HYPE) Breakdown Alert: Are the Bears Lining Up for a Drop to $20?

0
0
- Hyperliquid is currently trading at $40.
- HYPE’s daily trading volume is up by 52%.
With the solid 3.44% drop in the crypto market, the bears have reinforced their position. The majority of the assets are in the red zone, visiting their former support. Bitcoin and Ethereum are in a downtrend, currently trading at around $107.4K and $3.7K. Among the altcoins, Hyperliquid (HYPE) followed suit and posted a loss of over 3.04% in the last 24 hours.
The opening price for Hyperliquid was at $42.96, and after the bears took control, the asset’s price was pushed to the $40.29 range. At press time, Hyperliquid traded at $40.49, with its market cap staying at $13.61 billion. Besides, the daily trading volume has increased by over 52.27%, reaching $516.21 million. The HYPE market has seen a 24-hour liquidation of $4.82 million.
The Ali chart exhibits a potential Head and Shoulders formation on Hyperliquid, a bearish reversal pattern. If the price breaks below the neckline support around $38, the pattern confirms, signalling a possible extended downward momentum. The measured move likely points toward a target near the $20 level.
Will the Hyperliquid Momentum Reverse or Sink Deeper?
With Hyperliquid’s active downside pressure, the price could fall to the support at $39.82. A potential bearish correction might initiate the death cross to emerge, pushing the price back to its previous low at around $38.46. If the momentum takes a turn, the asset could see a surge in price, instantly climbing to the resistance at $41.53. Assuming the upside correction gains more traction, the golden cross might form, triggering the Hyperliquid price to $42.27.
Hyperliquid’s Moving Average Convergence Divergence line and the signal line are settled below the zero line. This indicates a bearish market condition. Even if the MACD line crosses above the signal line, it is seen as a weak or early bullish signal unless both move above the zero line.
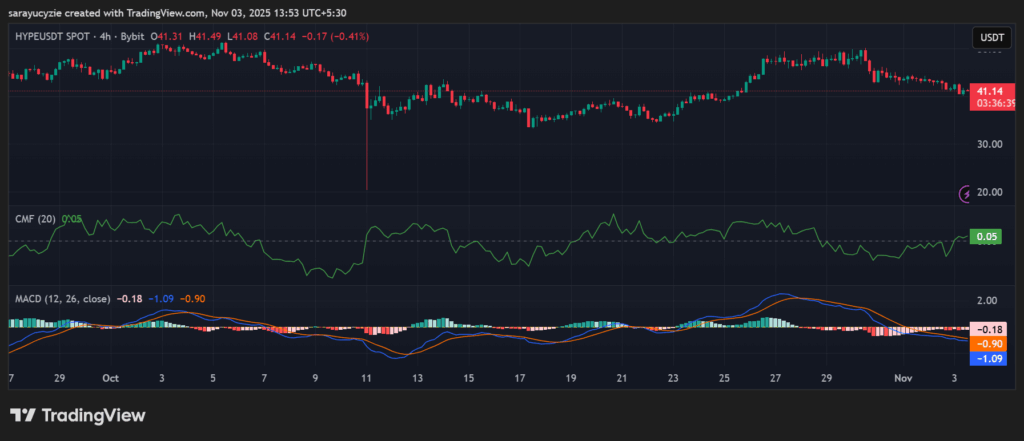
In addition, the Chaikin Money Flow (CMF) indicator of HYPE at 0.05 suggests slightly positive buying pressure in the market. With this value, the money is flowing into the asset, showing bullish bias but not strongly convincing. A mild accumulation is present rather than a strong bullish move.
Notably, the daily Relative Strength Index (RSI) of HYPE, positioned at 35.60, signals that it may approach oversold territory, below 30. A potential reversal would be forming soon if it continues dropping or starts moving upward. Hyperliquid’s Bull Bear Power (BBP) reading of -2.72 points out that the bears currently have the upper hand in the market. The sellers are stronger than the buyers, and the further below zero, the stronger the bearish pressure gets.
Top Updated Crypto News
Internet Computer (ICP) Breaks Out with a 10% Push: Fuel for a Bigger Run or Just a Quick Fade?
0
0


 Manage all your crypto, NFT and DeFi from one place
Securely connect the portfolio you’re using to start.


