SOL Price Prediction – Weekly Chart Indicates Bullish Trend, $200 In Sight?
4h ago•

bullish:
0
bearish:
0
Share
Key Takeaways:
- SOL price is signaling a strong uptrend above the $150 pivot level.
- It broke a key contracting triangle with resistance at $155 on the weekly chart.
- Solana could correct lower, but the bulls might soon aim for a move toward $200.

Solana price is showing signs of a bullish trend. SOL must stay above the $150 pivot level to soon target the $200 resistance zone.
Solana Price Turns Green
In the last analysis, we discussed how Solana could rally 20% and test the $188 resistance. The price cleared the $162 resistance zone and rallied. It even outperformed Bitcoin and Ethereum in the last two weeks.
SOL broke a key contracting triangle with resistance at $155 on the weekly chart to open the doors for a steady increase. There was a spike above the 76.4% Fib retracement level of the downward move from the $188.91 swing high to the $122.75 low.
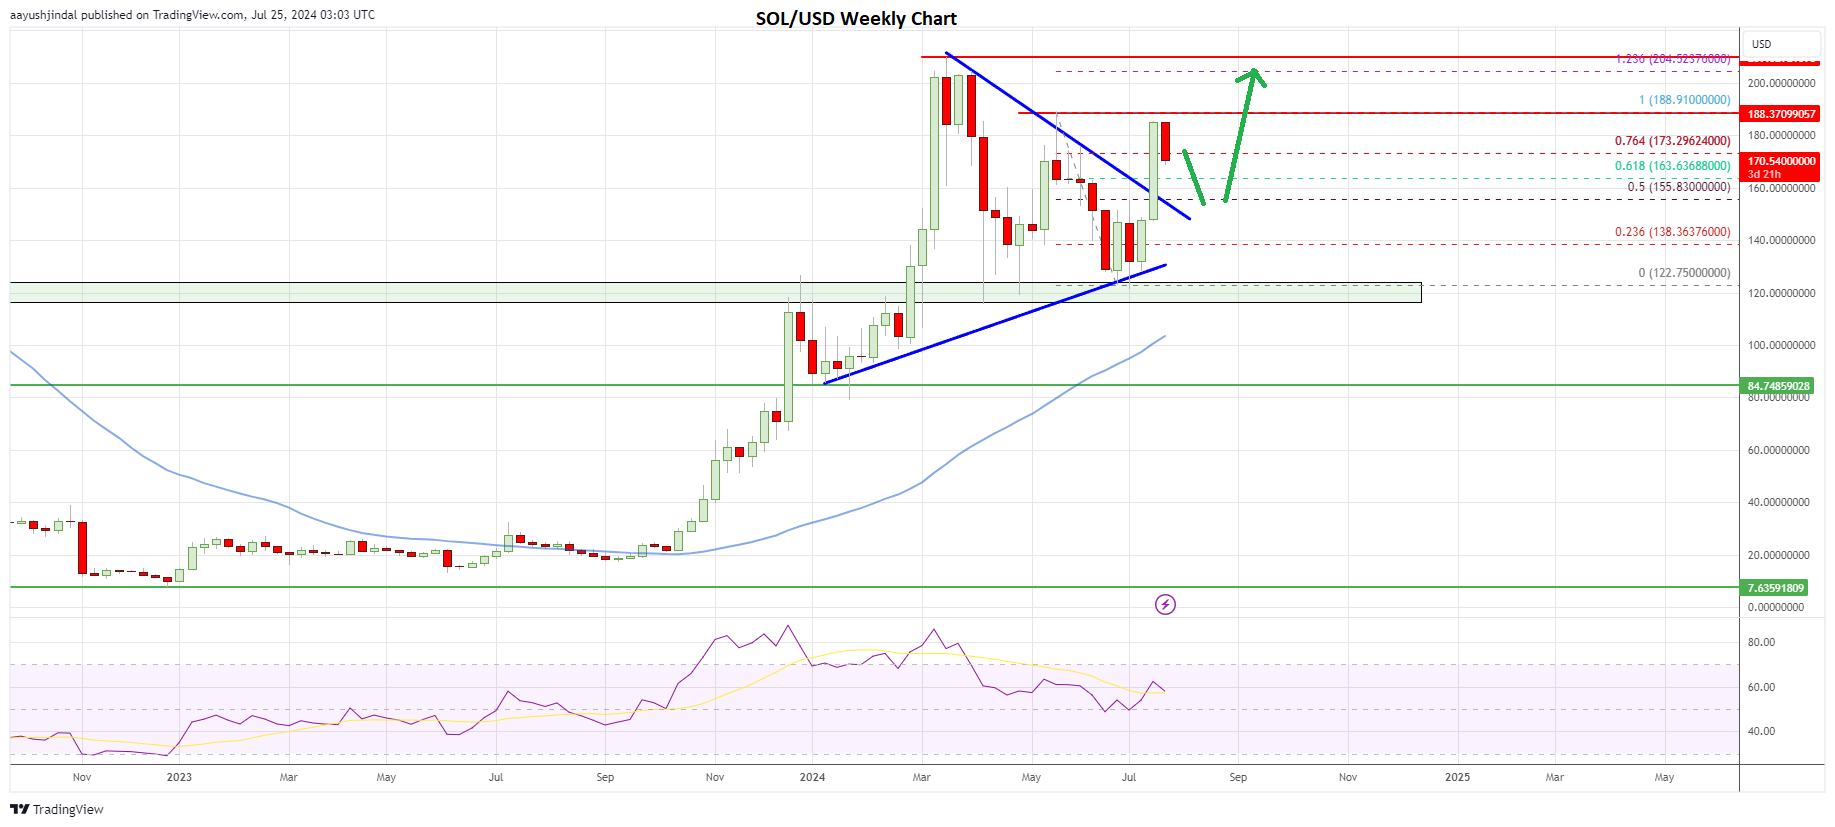
The price tested the $188 resistance zone and settled well above the 50-week simple moving average (blue). Recently, Solana saw a pullback below the $180 level. It seems like the price might correct lower below the $170 level in the coming sessions.
The first major support is near the $162 level (the last key breakout zone). The next major support is forming near the $155 level. The main uptrend support for the current wave sits at $150. If the bulls fail to protect the $150 support, the price could start another decline below $142.
In the stated scenario, Solana could revisit the $130 level. The next key support is near the $120 level, below which SOL price might test $100 or the 50-week simple moving average (blue).
Are Dips Supported In SOL?
Conversely, SOL might remain stable above $162 or $155 and continue higher. Immediate resistance on the upside is near the $180 level. The first major resistance is near the $188 level. If the bulls push the price above the $188 resistance, Solana price could gain bullish momentum.
The next key resistance for the bulls could be $200 and the 1.236 Fib extension level of the downward move from the $188.91 swing high to the $122.75 low. Any more gains might send Solana toward the $220 level.
Recently, Libre announced their alternative investment protocol on Solana with two mainstays of TradFi, Hamilton Lane and Brevan Howard. It allows investment in private funds, which was earlier limited to high-net-worth people with large (>$100k) minimum investments.
Overall, SOL price is signaling a steady uptrend above the $150 pivot level. It might soon continue higher toward the $200 level unless the bulls fail to protect $150.
The post SOL Price Prediction – Weekly Chart Indicates Bullish Trend, $200 In Sight? appeared first on CoinChapter.
4h ago•
bullish:
0
bearish:
0
Share

 Manage all your crypto, NFT and DeFi from one place
Securely connect the portfolio you’re using to start.

bullish:
0
bearish:
0

bullish:
0
bearish:
0

bullish:
0
bearish:
0

bullish:
0
bearish:
0