This On-Chain Metric Signals the Start of a Bitcoin Bull Market: Details
8h ago•

bullish:
0
bearish:
0
Share

Bitcoin sits at a key decision point as an on-chain metric signals early bull market conditions.
Bitcoin experienced a short pullback after briefly crossing $97,000 on May 2, dipping to just under $94,000—reflecting a 3-4% retracement from the recent peak. Despite this short-term movement, analysts suggest deeper on-chain indicators are beginning to paint a more pivotal picture of market direction.
While the 7-day and 24-hour returns indicate marginal declines of -0.1% and -1.0% respectively, the longer-term data remains strong, with gains of 8.0% over the past 14 days and 13.3% over the past 30 days.
Composite Index Signals Early Bull Market Phase
Amid this performance, momentum metrics have shifted focus to the Bitcoin Composite Index v2.0, a tool that blends on-chain and price-based indicators to assess market sentiment.
According to analyst Constantin Kogan, the current reading of 0.8 on the index mirrors historical conditions seen at the beginning of past bull runs. Data shows that when this threshold has been breached and maintained, it has often preceded significant upward price moves.
https://twitter.com/constkogan/status/1919057977673208253
Notably, the "Running ATH Price" line within the index has started to trend upward, indicating rising investor confidence. The index approaching the critical 1.0 level could mark a transition toward stronger bullish momentum. If Bitcoin sustains above this zone, historical data suggests it could enter a rally phase similar to the parabolic rises in 2017 and 2021.
Under such a scenario, the analyst indicates a potential price target range of $150,000 to $175,000. However, if the index remains between 0.8 and 1.0, Bitcoin may instead enter a consolidation phase between $90,000 and $110,000.
Meanwhile, a drop below 0.75 could lead to a correction toward the $70,000 to $85,000 range, though this is the least probable scenario.
UTXO Data Reveals Crucial Supply Pressure Zone
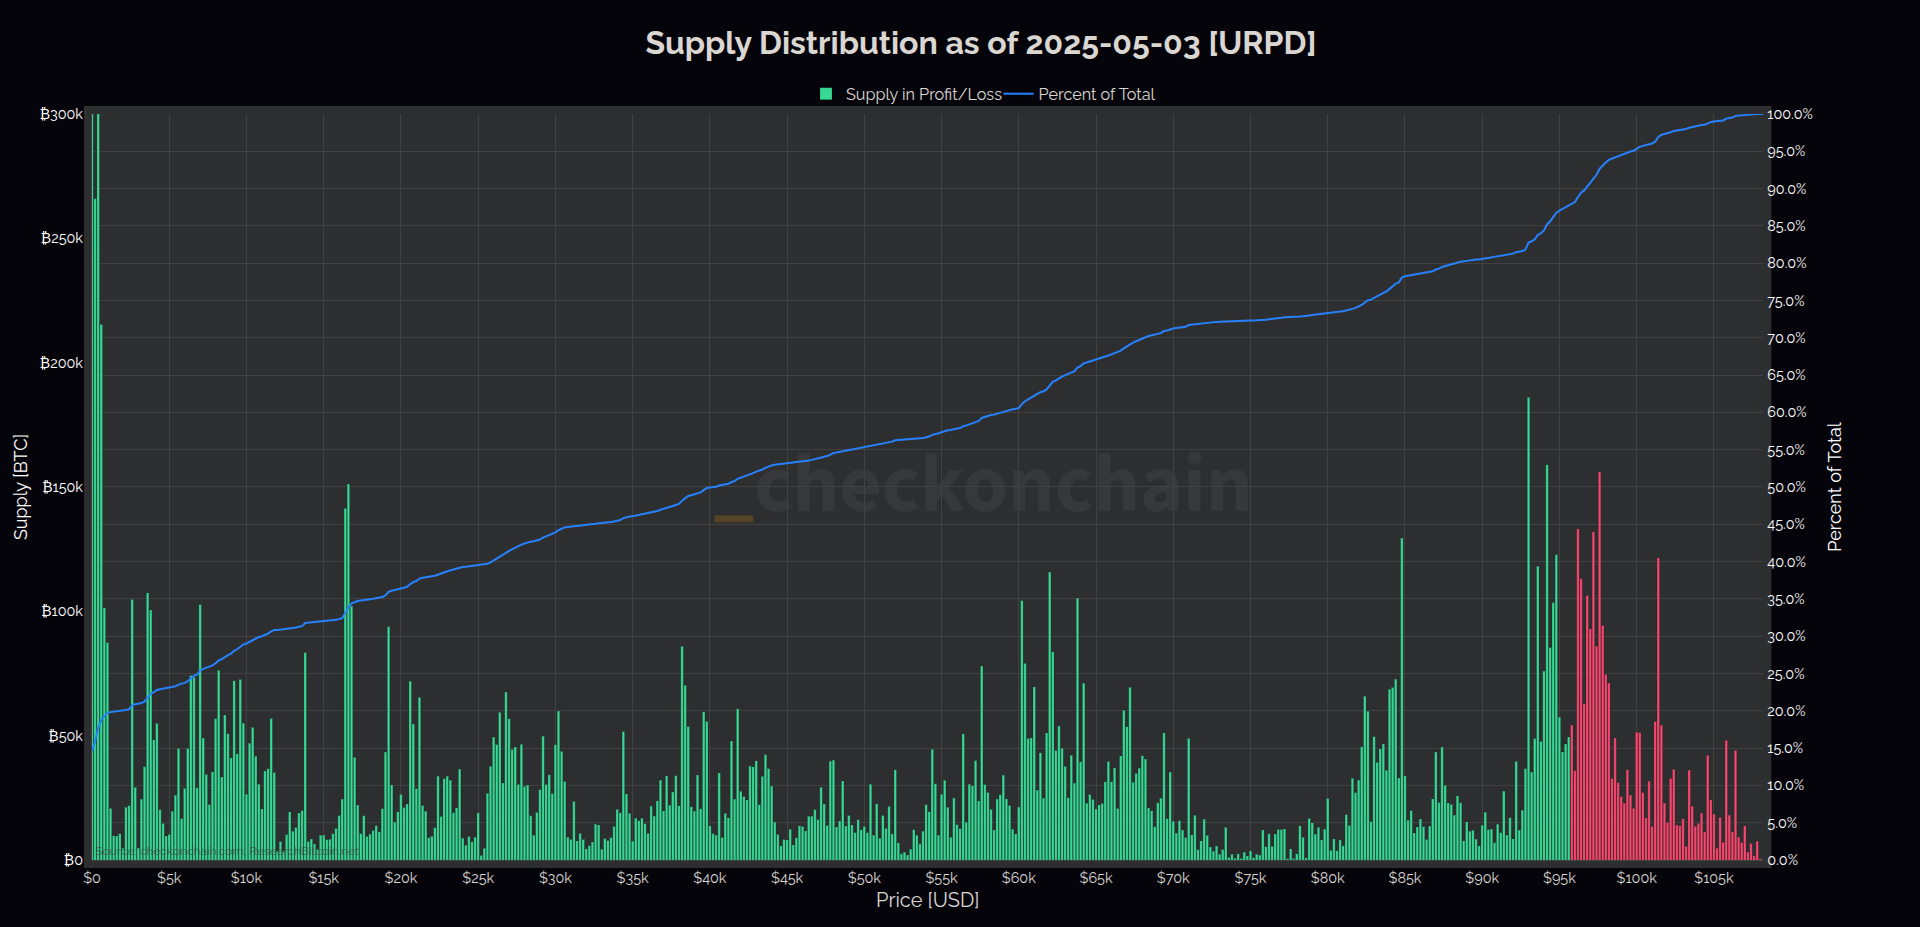
Another analytical layer emerges through the UTXO Realized Price Distribution (URPD) chart, shared by analyst Checkmate. This tool maps Bitcoin’s supply against the prices at which it was acquired.
 The chart’s histogram shows where BTC was last moved, reflecting investors' cost bases. The most notable feature is the concentration of supply at significantly lower acquisition prices, reflecting long-term holders who are deep in profit and likely not selling, contributing to ongoing supply constraints.
A zone of interest lies between $93,000 and $98,000, where investors acquire a substantial amount of BTC. With Bitcoin trading near $94,000, the market appears to be at a decision point.
According to the analyst, a strong breakout—marked by a decisive candle—could confirm bullish continuation by flipping recent supply into profit and fueling upward momentum. Conversely, a rejection at these levels may signal a lower high formation, increasing the likelihood of a deeper correction as selling pressure builds.
The chart’s histogram shows where BTC was last moved, reflecting investors' cost bases. The most notable feature is the concentration of supply at significantly lower acquisition prices, reflecting long-term holders who are deep in profit and likely not selling, contributing to ongoing supply constraints.
A zone of interest lies between $93,000 and $98,000, where investors acquire a substantial amount of BTC. With Bitcoin trading near $94,000, the market appears to be at a decision point.
According to the analyst, a strong breakout—marked by a decisive candle—could confirm bullish continuation by flipping recent supply into profit and fueling upward momentum. Conversely, a rejection at these levels may signal a lower high formation, increasing the likelihood of a deeper correction as selling pressure builds.8h ago•
bullish:
0
bearish:
0
Share


 Manage all your crypto, NFT and DeFi from one place
Securely connect the portfolio you’re using to start.


