Aptos price prediction for 2024 – 2030: Will APT token hold bullish hopes?

0
0
Key takeaways:
- Our APT price prediction anticipates a high of $13.23 by the end of 2024.
- In 2025, it will range between $23.81 and $28.89, with an average price of $24.65.
- In 2030, it will range between $104.83 and $123.83, with an average price of $107.77.
Aptos has aggressively attracted capital into its ecosystem. The network has a total value locked (TVL) of $376.82 million in decentralized applications, with its stablecoin market cap is $112.05 million.
Aptos is a high-performance Layer 1 blockchain with a mature ecosystem comprising a variety of decentralized finance (DeFi) applications.
Aptos Network continues to build more applications and tools for developers. But how about the performance of APT? How high will it go? Is APT a good investment? Let’s explore APT performance and price predictions from 2024 to 2030.
Overview
| Cryptocurrency | Aptos |
| Ticker | APT |
| Current Aptos price | $8.43 |
| Crypto Market cap | $3,694,888,353 |
| Trading volume | $165,127,807 |
| Circulating supply | 438,265,939 |
| All-time low | $3.09 on Dec 30, 2022 |
| All-time high | $19.90 on Jan 30, 2023 |
| 24-hour low | $8.61 |
| 24-hour high | $8.22 |
APT price prediction: Technical analysis
| Metric | Value |
| Volatility (30-day variation) | 4.51% |
| 50-day SMA | $8.96 |
| 200-day SMA | $10.01 |
| Sentiment | Bearish |
| Fear & greed index | 75 (Greed) |
| Green days | 12/30 (40%) |
APT price analysis: APT trades at its lowest
Key takeaways:
- APT is trading at its lowest Fibonacci range this year.
- The current correction will be short-lived.
APT/USD 1-day chart: APT negative momentum on the rise

APT is trading at its lowest Fibonacci range this year. Its negative momentum has risen over the last three days, raising the chances of a new annual low. The support and resistance levels are $8.11 and $10.17, respectively. These levels are crucial to determining the direction of the next breakout.
APT/USD 4-hour chart: APT in correction
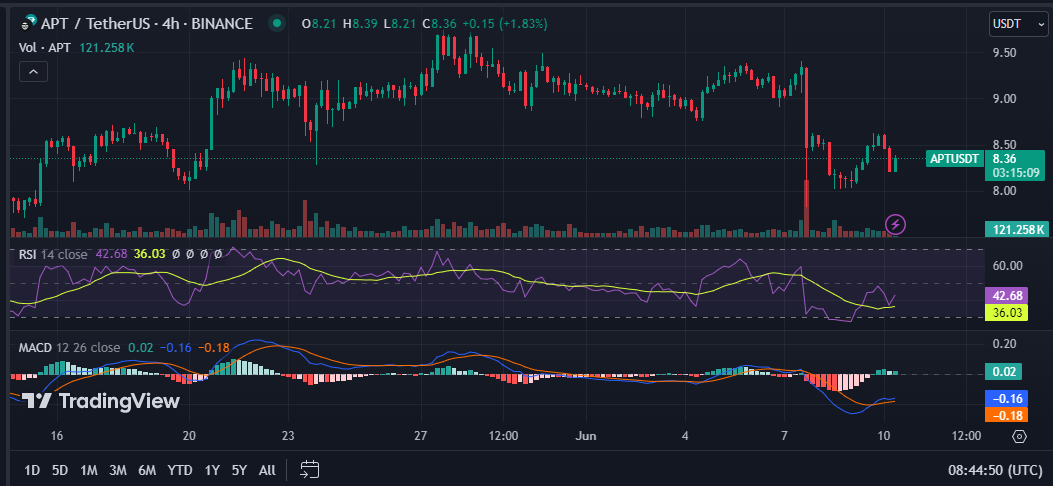
Aptos is highly volatile in the shorter timeframe and better indicates the next price movement. It registers positive momentum and is corrected from the recent red engulfing candle. The RSI is neutral, meaning the correction in play will not be long-lived.
APT technical indicators: Levels and action
Daily simple moving average (SMA)
| Period | Value ($) | Action |
| SMA 3 | 8.85 | SELL |
| SMA 5 | 9.04 | SELL |
| SMA 10 | 9.00 | SELL |
| SMA 21 | 8.97 | SELL |
| SMA 50 | 8.96 | SELL |
| SMA 100 | 11.28 | SELL |
| SMA 200 | 10.01 | SELL |
Daily exponential moving average (EMA)
| Period | Value ($) | Action |
| EMA 3 | 9.03 | SELL |
| EMA 5 | 9.08 | SELL |
| EMA 10 | 9.08 | SELL |
| EMA 21 | 9.03 | SELL |
| EMA 50 | 9.54 | SELL |
| EMA 100 | 10.07 | SELL |
| EMA 200 | 9.84 | SELL |
What can you expect from APT price analysis next?
Our analysis shows the current sentiment is Bearish, while the Fear & Greed Index shows 75 (Greed). Aptos recorded 12/30 (40%) green days with 4.51% price volatility over the last 30 days. The charts show APT trades within the lowest range of the year.
Recent news/ opinions
The first secure on-chain randomness API for proof-of-stake blockchains is now live on Aptos. This new implementation is called Aptos roll.
Aptos roll has many applications, such as decentralized games, raffles, randomized NFTs, and randomized airdrops. Many decentralized applications will benefit from randomness regarding fairness, security, and functionality.
APT price prediction June 2024
The Aptos price forecast for June is a maximum of $10.13 and a minimum of $7.62. The average trading price for the month will be $9.51.
| Month | Potential low ($) | Potential average ($) | Potential high ($) |
| June | 7.62 | 9.51 | 10.13 |
APT price prediction 2024
For the second half of 2024, APT’s price will range between $7.62 and $13.23. The average price for the period will be $11.68.
| Year | Potential low ($) | Potential average ($) | Potential high ($) |
| 2024 | 7.62 | 11.68 | 13.23 |
APT price prediction 2025-2030
| Year | Potential low ($) | Potential average ($) | Potential high ($) |
| 2025 | 16.50 | 16.97 | 19.87 |
| 2026 | 23.81 | 24.65 | 28.89 |
| 2027 | 35.29 | 36.52 | 41.32 |
| 2028 | 49.09 | 50.55 | 59.90 |
| 2029 | 71.43 | 73.45 | 85.45 |
| 2030 | 104.83 | 107.77 | 123.83 |
Aptos price prediction 2025
The Aptos APT price prediction for 2025 is a high of $19.87. It will reach a minimum price of $16.50 and an average price of $16.97.
Aptos price prediction 2026
The Aptos price prediction estimates it will range between $23.81 and $28.89, with an average price of $24.65.
Aptos price prediction 2027
Aptos coin price prediction climbs even higher into 2027. According to the prediction, APT’s price will range between $35.29 and $41.32, with an average price of $36.52.
Aptos price prediction 2028
Our analysis indicates a further acceleration in APT’s price. It will trade between $49.09 and $59.90 and average $50.55.
Aptos price prediction 2029
According to the APT coin price prediction for 2029, the price of APT will range between $71.43 and $85.45, with an average price of $73.45.
Aptos price prediction 2030
According to the Aptos price prediction for 2029, Aptos’s price will range between $104.83 and $123.83, with an average of $107.77.
APT market price prediction: Analysts’ APT price forecast
| Firm | 2024 | 2025 |
| Digitalcoinprice | $16.03 | $20.68 |
| Gate.io | $8.32 | $8.86 |
| Changelly | $9.97 | $21.02 |
Cryptopolitan’s APT price prediction
Our predictions show that Aptos will achieve a high of $13.23 in the second half of 2024. In 2025, it will range between $16.50 and $19.87, with an average of $16.97. In 2030, it will range between $104.83 and $123.83, with an average of $107.77. Note the predictions are not investment advice. Seek independent consultation or do your own research.
APT historic price sentiment
- Aptos raised seed funding in January 2022, led by a16z. Series A funding included Apollo, Dragonfly, Franklin Templeton, and others.
- Some of the members previously worked on the Diem blockchain proposed by Facebook.
- The Aptos mainnet launched in October 2022 with an initial supply of 1 billion tokens.
- After the launch hype, APT fell to its lowest in December 2022, at $3.09. A month later, the tables turned, as it peaked at an all-time high of $19.90 on January 30, 2023.
- In January, it pumped, partly driven by the non-fungible token market. Collections such as Aptos Monkeys and Aptomingos have attracted more users. Aptos was bearish in Q1 2023.
- On 6th June, APT fell below its initial listing price and extended the losses in the preceding months.
- In October, it started correcting, rising as high as $8.47 in November.
- In 2024, it broke above the $10 mark, reaching a high of $18 in March.
- From April, it reversed sharply and was traded below $10.

0
0

 Manage all your crypto, NFT and DeFi from one place
Securely connect the portfolio you’re using to start.

0
0


0
0