Injective (INJ) Breaks 6-Month Downtrend, How Far Can It Go?

0
0
The crypto market has turned green over the last 24 hours, with Bitcoin testing the $95,000 zone and attempting a breakout.
While the BTC was at $93K at the time of writing, the price surge in the leading cryptocurrency extended across the broader market.
Altcoins like Solana, Cardano, and XRP are also seeing local highs. Among the standout performers, Injective (INJ) has captured attention.
it broke through a multi-month downtrend, signaling a possible shift toward bullish territory. Here’s what traders need to know.
Crypto Market Enters Renewed Uptrend
The crypto market has been in a renewed uptrend since Monday of this week, after getting a strong start to the next few days.
Price action had been muted over the last two weeks before, with Bitcoin and other cryptocurrencies trading sideways.
However, market sentiment appears to have flipped bullish as it stands, with Bitcoin’s breakout of its sideways range above $87,000 and towards $94,000.
Other cryptocurrencies have also seen impressive upticks within the same timeframe, and are now outperforming traditional stocks after the recent $1.5 trillion wipeout from Wall Street.
Bitcoin is up by almost 6% over the last 24 hours and is trading above the psychological $85,000 support.

Ethereum, on the other hand, is up by around 11% within the same timeframe. Its dominance was testing the 8% mark.
Ripple has also broken above the $2.22 resistance. And it was trading at around $2.26 after rising by 8% over the last 24 hours.
Other major performers include Solana, Dogecoin, Cardano, Chainlink, Stellar (XLM), Toncoin (TON), Hedera (HBAR), Litecoin (LTC), and Polkadot (DOT) with all these seeing between 5% to 10% price increases.
Injective Steals the Spotlight with Breakout
According to data from CoinMarketCap, Injective stole the spotlight so far, rising by nearly 10% in the last 24 hours to a current price of $9.49.

More than this price increase, the cryptocurrency’s trading volume also shot up by more than 100% over the same timeframe.
Its $135 million trading volume indicates bullish confidence that has taken its market cap to the $950 million range.
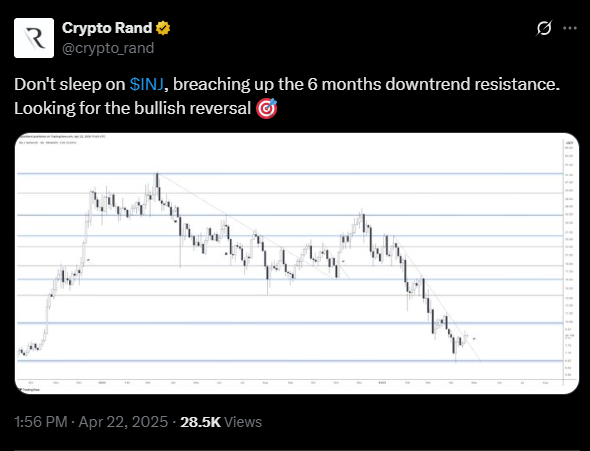
According to insights from analyst Crypto Rand in a recent market update, Injective has now broken through a 6-month downtrend and is looking towards a bullish reversal.
Investors should keep in mind that Injective is now testing a major resistance zone around $10. This level is also a psychological barrier.
As it stands, chart analytics show that a break above this psychological zone could lead INJ up towards higher highs. The coin can go as high as the $18 mark.
The RSI on the INJ/USDT daily chart shows that the cryptocurrency’s price action is strongly in bullish territory, which means that the ongoing price increase is likely to continue.
Overall, investors must note that a failure on INJ’s part to break and close above this $10 zone could lead to a rejection.
Said rejection could see INJ travel further down towards the $6 zone. On the other hand, another break below $6 would invalidate all bullish outlooks and lead to lower lows for the cryptocurrency.
The post Injective (INJ) Breaks 6-Month Downtrend, How Far Can It Go? appeared first on The Coin Republic.
0
0


 Manage all your crypto, NFT and DeFi from one place
Securely connect the portfolio you’re using to start.


0
0