BONK Surges 11% as Technical Revival Signals Bullish Momentum Ahead

0
0

- Bonk showed a remarkable surge in the last 24 hours, suggesting bullishness.
- RSI and MACD demonstrating a positive sign means buyers are genuine and rally is reliable.
BONK’s daily technical charts show that this meme coin is seemingly going through a significant technical revival following months of consolidation. The price action indicates that BONK managed to break above major moving average smart resistance, which can indicate that the market sentiment and momentum will start to swing in favour. As per CMC data, currently, Bonk is trading at $0.00001820 with an intraday surge of 11% showcasing bullishness.
The most notable change is that BONK crossed the 50-day EMA of market value at $0.00001587 and the 200-day EMA at $0.00001812. Such a technical breakout is a very important technical milestone because the price had been going below these moving averages for quite some time. The 200-day EMA has been serving as dynamic resistance for a long time, which Bonk broke recently. The recent movement of the BONK indicates that buyers can become influential and propel the meme coin in potentially bullish directions.
The RSI indicator is in the bullish territory (63) but not overbought, leaving scope to have a further upward movement. This reading would indicate healthy buying pressure without leaving out the additional gains before reaching extreme levels that may result in profit-taking. The momentum oscillator shows that buyers are interested not in a spike but in the long run.
What’s Next For Bonk Price?
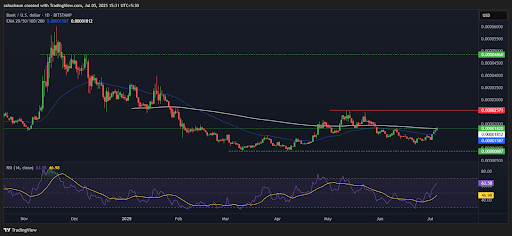
The MACD analysis demonstrates positive indications as the MACD line and signal line form a golden cross and are growing. The green histogram bars show that the bullish momentum is building up, and the positive direction of the MACD line indicates that the new breakout has good technical support. This convergence of momentum indicators is usually followed by long-lasting price increases.
The social sentiment analysis has positive readings, which are usually associated with the performance of meme coins since they are community-driven. The conjunction of the technical indicators’ improvement and the positive social sentiment forms a potentially friendly environment for the price increase.
Risk management-wise, the traders will be keen on the $0.00001587 level, which has become a critical support level after being a resistance point. This is where the 50-day EMA is, and it is the first line of defence by the buyers. Positively, the short-term resistance level stands at $0.00002571, which is the next major obstacle to the recovery of BONK.
From a technical point of view, Bonk is making a serious comeback. If the price sustains above the key EMAs the investors may notice the higher levels soon.
Highlighted Crypto News Today:
Major Security Breach Hits Brazil’s Banking Infrastructure; Lost $140M
0
0

 Manage all your crypto, NFT and DeFi from one place
Securely connect the portfolio you’re using to start.


0
0
