Celestia (TIA) Price Prediction 2025–2030: Can TIA Recover Hit $2 Soon?
0
0

- TIA clings to a crucial support zone—can bulls prevent a deeper collapse below $1.45?
- Bearish momentum dominates, but widening Bollinger Bands hint at incoming volatility—will it break up or down?
- A return above $1.52 could spark a short-term relief rally—yet all EMAs remain firmly against the trend.
Despite consistent rejections, the $1.38–$1.45 demand zone may offer a springboard if bulls step in. On-chain outflows and bearish momentum dominate, but if volume returns, a shift back toward $2 remains possible.
Celestia (TIA) stands at a critical decision point, having posted continuous losses in the past months. Selling at a price with little value above $1.45, a tested support area, the token is losing most of its previous 2024 gains and risks additional losses pending a sharp increase in buyers until it reaches lower price values. Nevertheless, although TIA is still trapped in a macro downtrend, there are certain characteristic structural areas along with expanding ranges of volatility that indicate that a trend reversal may come later in 2025.
Also Read: Terra Classic (LUNC) Price Prediction 2025–2030: Can LUNC Hit $0.0001 Soon?
Technical Analysis
Trend Structure and Price Zones
The unit has been battling in a demanding area between 1.43 and 1.46, and it is already trading near 1.48. Since late June, this area has served as the final prominent support on the 4-hour and daily time frames. Should this support break, then TIA may drift down towards 1.38 or even 1.34, both former zones of accumulation.
Encouragingly, immediate resistance is at $1.52, aligning with the 4-hour 20 EMA, while a recent swing high at $1.66 represents a more significant hurdle to overcome.
This stage has been repelling price repeatedly since early July and will continue until it is conclusively breached. TIA remains locked within an even deeper corral of downward pressure.
RSI, MACD, and Bollinger Bands
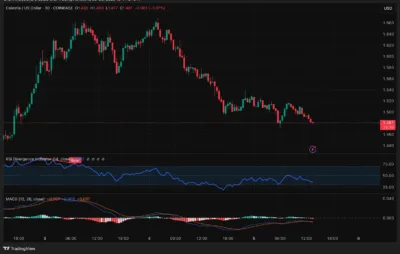
Currently, smaller timeframes show no signs of bullish recovery, as the RSI has retraced below 40 on the 30-minute chart, signaling fading intraday momentum. With a bearish divergence created around the high at the 1.66 level, the trend remains one-sided on the downside.
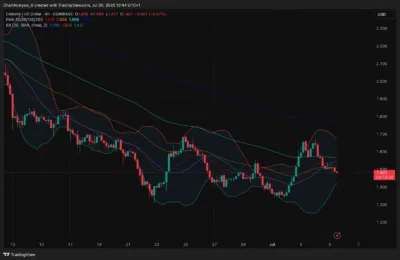
The MACD indicator, which briefly attempted a bullish crossover, has turned back to a bearish position. Combined with Bollinger Bands continuing to widen on the 4-hour chart—as candles embrace the bottom band—there is evident caution that downside volatility is increasing.

Source: Tradingview
Weekly Chart and Long-Term Construction
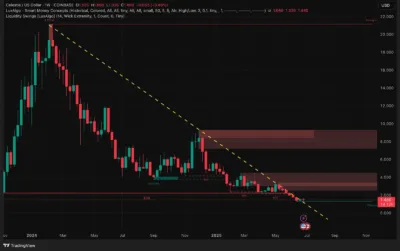
On the macro scale, the weekly chart still observes a long-term falling trendline out of the all-time high of TIA around 20. A short breakout in the first half of June did not stick, causing a break of structure (BOS) at 1,500, which has now become resistance itself.
The asset continues to print lower highs and lower lows, and no reversal pattern has been confirmed for higher timeframes. Without the curbing of the present configuration, price can still hemorrhage to the psychological value of $1.30, which was touched during the April 2025 capitulation.

Source: Tradingview
Exponential Moving Averages (EMAs)
On the 4-hour view, all the significant EMAs are stacked significantly above the current price, with the 20 EMA finding a dynamic resistance at $1.51, the 50 EMA at $1.50, the 100 EMA at $1.56, and the 200 EMA at $1.71.
The 100 EMA has not been touched since early July, adding more strength to the fact that bullish attempts continue to be rejected.

Source: Tradingview
On-Chain Analysis: Weak Spot Flows
According to Coinglass data, on July 5, TIA experienced—$208K in net outflows, highlighting the capital leaving the market as the price decreased to below 1.50. This shows that the traders are squaring up and not buying the dip, adding weight to the absence of demand-side support.
Unless there are signs of inflows picking up, there is a significant danger of a further decline until there are inflows that will reverse the situation.

Source: Coinglass
TIA Price Forecast Table: Year-by-Year Breakdown
| Year | Low ($) | Average ($) | High ($) |
| 2025 | 1.30 | 1.55 | 2.00 |
| 2026 | 1.45 | 1.88 | 2.40 |
| 2027 | 1.62 | 2.10 | 2.90 |
| 2028 | 1.80 | 2.45 | 3.30 |
| 2029 | 2.10 | 2.80 | 3.70 |
| 2030 | 2.40 | 3.15 | 4.20 |
Year-by-Year Outlook
2025
Celestia’s price action in 2025 will be defined by its ability to defend the $1.43–$1.45 zone. A decisive hold and rally above $1.52 may invite a short-term relief rally to $1.66 or $2.00, but without volume, any upside move is likely to face sharp resistance.
2026
If broader crypto market sentiment improves, TIA could target the $2.40 zone, especially if development around Celestia’s modular architecture begins to gain traction.
2027
A macro altcoin cycle could allow TIA to break above $2.90, potentially forming a rounded bottom or other long-term reversal pattern. By then, reclaiming previous supply zones between $2.60 and $3.00 would be essential.
2028
Assuming further ecosystem growth or new rollup integrations, TIA may climb toward the $3.30 level, particularly if modular blockchains dominate scalability narratives.
2029–2030
With its protocol maturing and wider adoption, Celestia could potentially exceed $4.00, especially if institutional players begin to integrate data availability layers. This depends heavily on execution and competitive dynamics in the Layer-1 and Layer-2 ecosystems.
Conclusion
After several months of steep declines, Celestia (TIA) is approaching a crucial make-or-break support at $1.45. While the current trend is bearish and on-chain data confirms weak buyer interest, the proximity to multi-tested support levels and expanding volatility could offer an opportunity for bottom formation.
If bulls reclaim key levels such as $1.52 and $1.66, TIA could enter a relief rally phase before mounting a longer-term recovery through 2026–2027. However, a breakdown below $1.43 would likely expose $1.30, which could redefine Celestia’s long-term outlook.
FAQs
1. Is TIA currently bullish?
No. TIA is still in a macro downtrend, with bearish RSI, MACD, and rejection from key EMAs.
2. What is the strongest support zone right now?
The $1.43–$1.45 area has absorbed repeated downside pressure and remains critical.
3. What resistance levels must be broken for a sustained rally?
$1.52 and $1.66 must be reclaimed to invalidate the bearish setup and initiate a trend reversal.
4.Can TIA reach $2 again?
Yes. A reclaim of the 100 EMA and a strong bounce with volume could push TIA back to $2.00 or higher within the next 6–12 months.
5. What’s driving the current downtrend?
Consistent on-chain outflows, failed EMA reclaims, bearish momentum indicators, and a lack of accumulation are driving the ongoing weakness.
Also Read: Pudgy Penguins (PENGU) Price Prediction 2025–2030: Can PENGU Flip $0.05 Resistance?
The post Celestia (TIA) Price Prediction 2025–2030: Can TIA Recover Hit $2 Soon? appeared first on 36Crypto.
0
0
 Manage all your crypto, NFT and DeFi from one place
Securely connect the portfolio you’re using to start.


