XRP Price Turns Bearish With a Potential Death Cross Approaching

0
1

XRP shows signs of weakening, having traded down more than 4% over the past seven days. Momentum indicators like the RSI have dropped sharply to 39, signaling growing bearish pressure.
The Ichimoku Cloud and EMA patterns both point to a continuation of the downtrend, with a potential death cross looming on the charts. Unless XRP can defend key support levels and break through overhead resistance, the path ahead remains tilted toward further downside.
XRP Momentum Weakens as RSI Slips Toward Oversold Zone
XRP’s Relative Strength Index (RSI) has dropped sharply to 39, down from 50.84 just a day ago.
This marks a notable shift in short-term momentum, suggesting that selling pressure is building as buyers retreat.
The drop below the neutral 50 level signals that bears are currently in control. Unless momentum reverses, XRP could continue drifting lower in the near term.
 XRP RSI. Source: TradingView.
The RSI is a momentum oscillator that measures the speed and change of price movements, ranging from 0 to 100. Readings above 70 typically indicate overbought conditions—often a warning that an asset may be due for a pullback—while readings below 30 suggest oversold conditions and potential for a rebound.
XRP’s RSI is now at 39, which indicates that it is entering bearish territory but hasn’t yet reached oversold levels.
If the RSI continues to slide toward or below 30, it could open the door for a potential bounce—but for now, the trend points to weakening momentum and caution for bullish traders.
XRP Remains Bearish Below Ichimoku Cloud Resistance
The Ichimoku Cloud chart for XRP shows a clearly bearish setup. The price action is currently below the cloud (Kumo), which is shaded red—a signal of ongoing downward momentum.
The Leading Span A (green line) is also below Leading Span B (red line), reinforcing the bearish sentiment ahead.
The Tenkan-sen (blue line) is below the Kijun-sen (red line), indicating that short-term momentum is weaker than the medium-term trend.
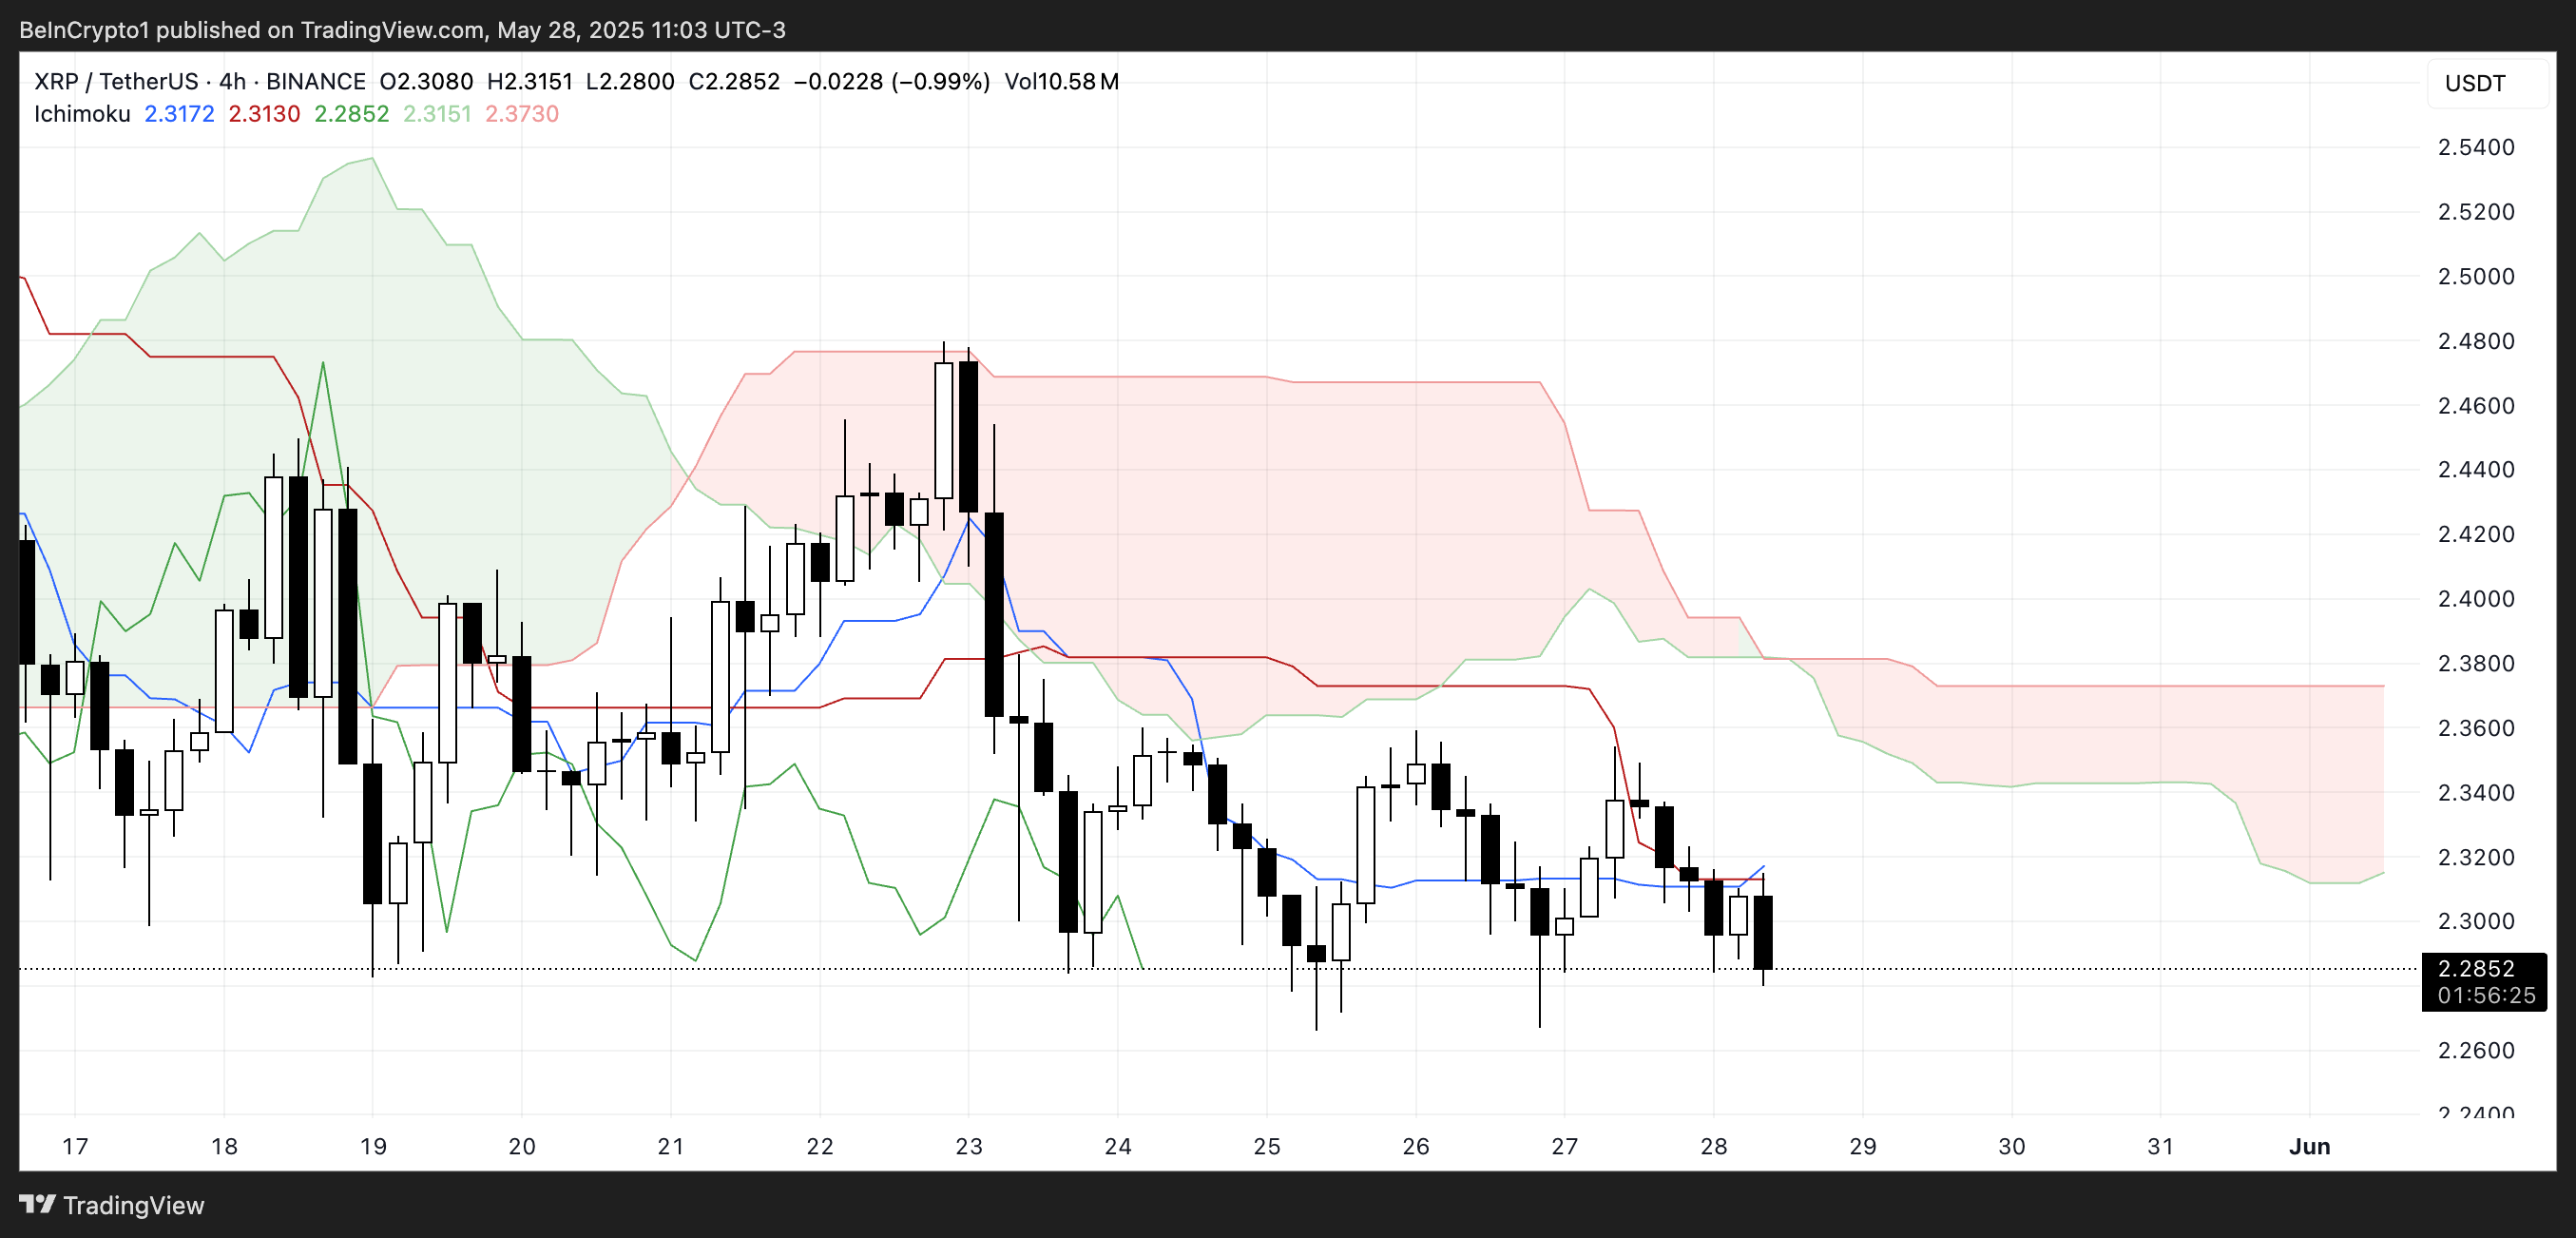 XRP Ichimoku Cloud. Source: TradingView.
Additionally, the cloud ahead is flat and thick, suggesting strong resistance levels if XRP attempts to rebound.
With no bullish crossover in sight and the price consistently failing to break back above the Tenkan-sen and Kijun-sen, the chart reflects continued pressure from sellers.
Unless XRP can close above the cloud and flip the Span A above Span B, the trend will likely favor the bears.
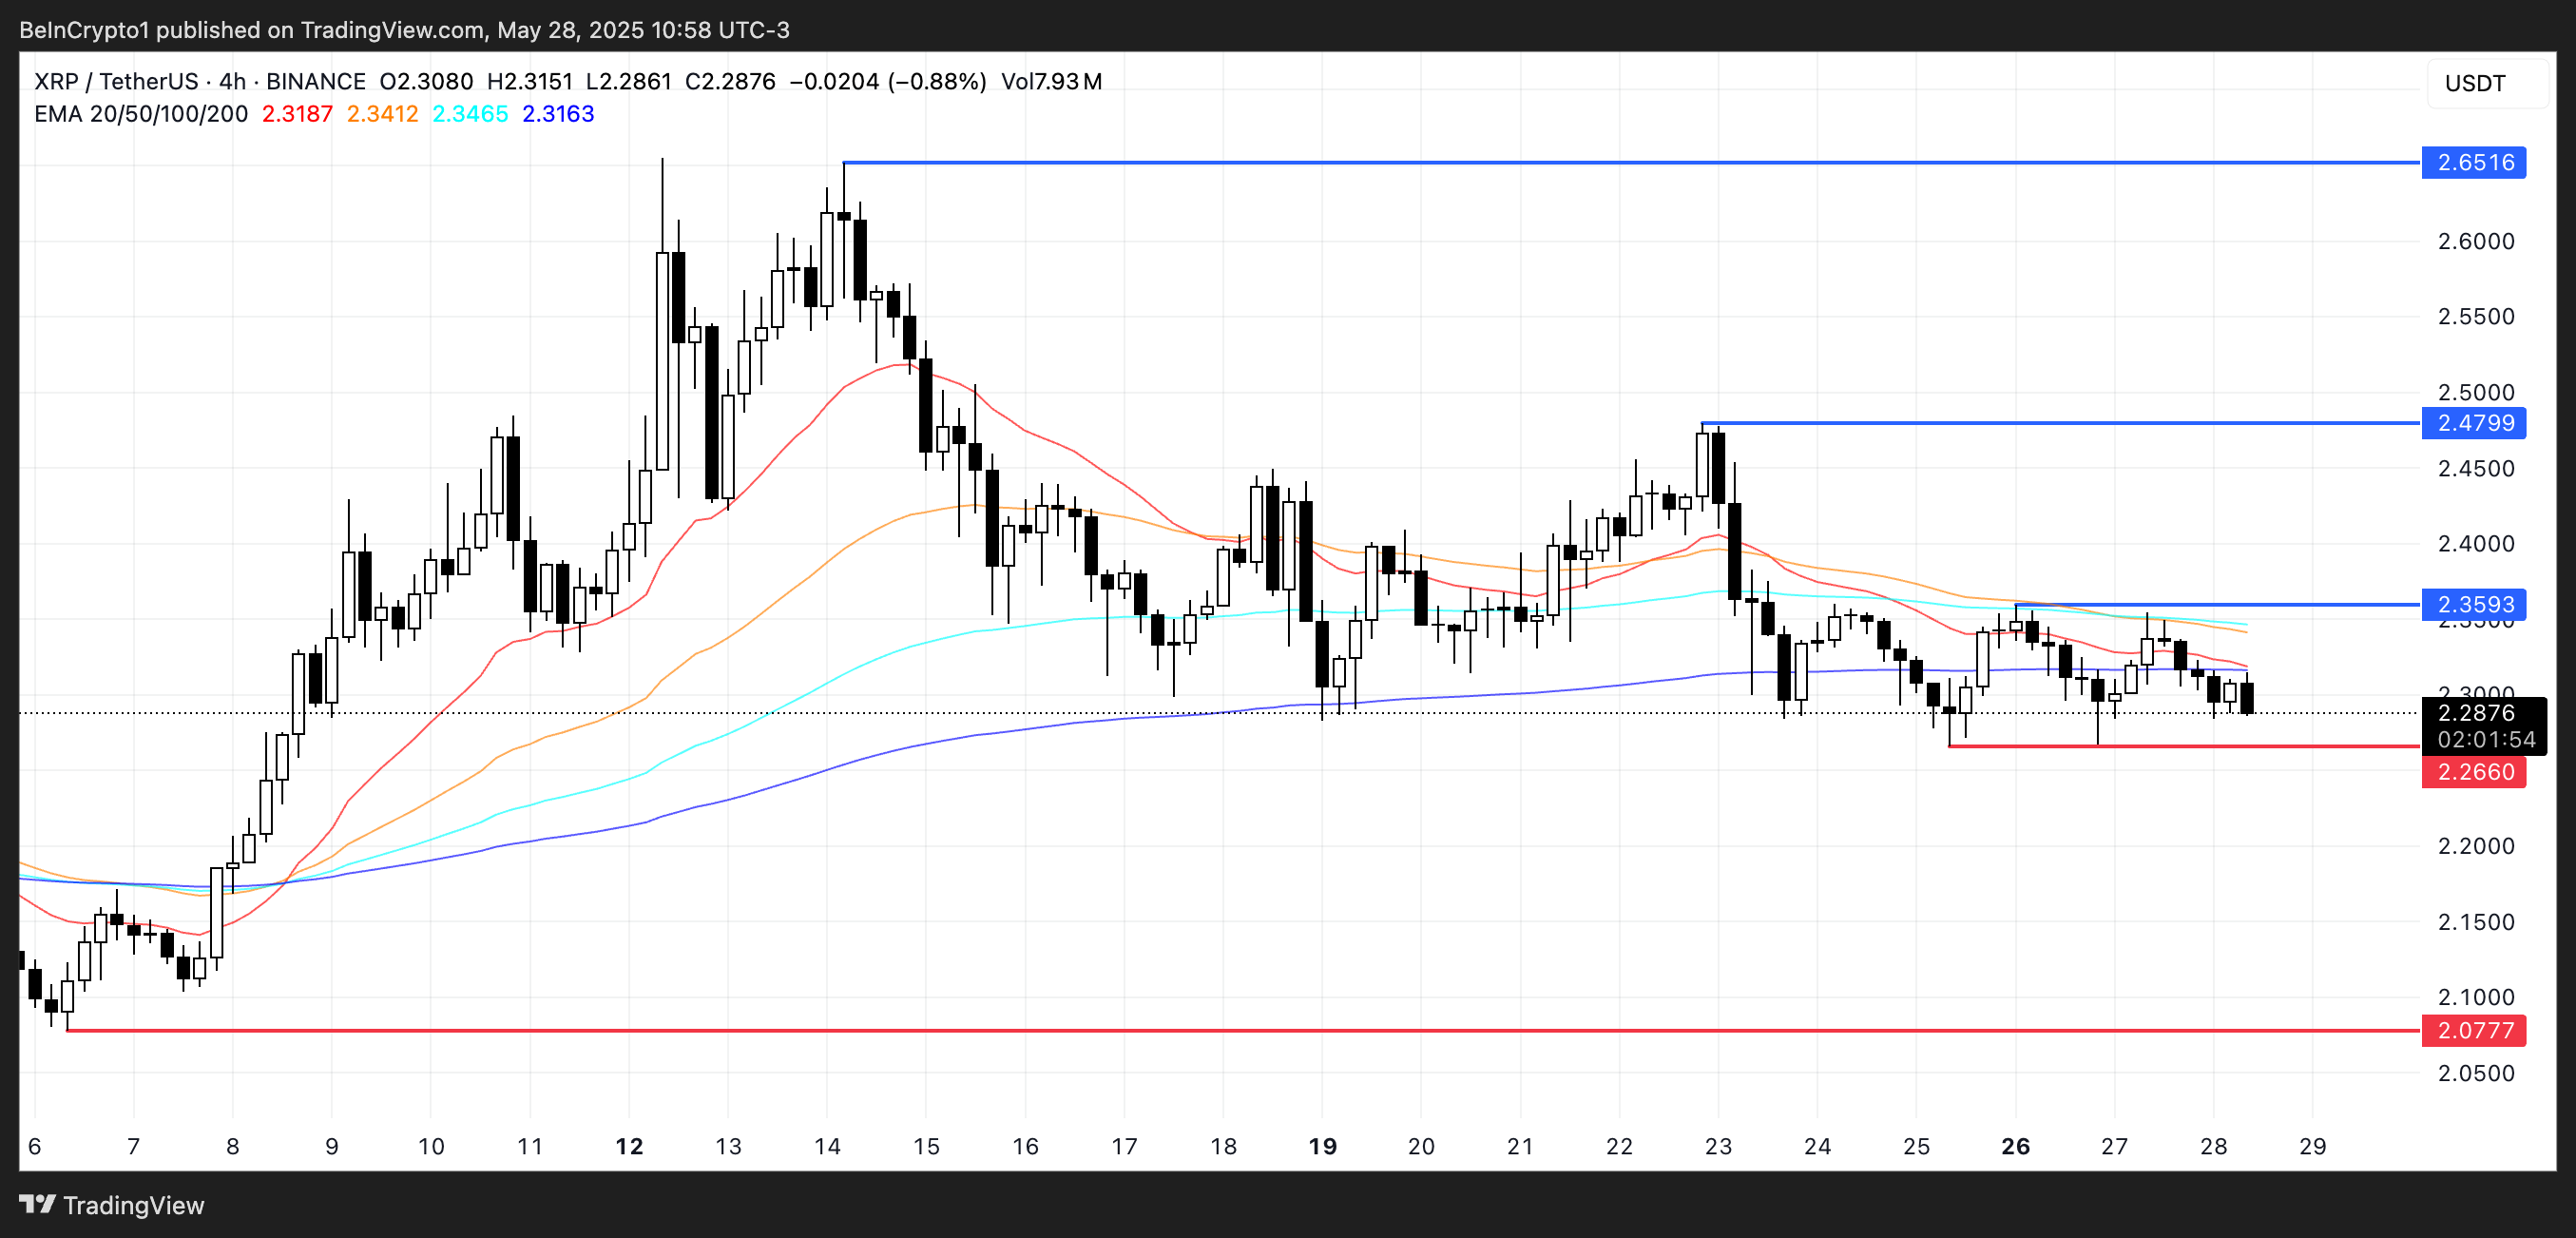
XRP Death Cross Looms as Key Support Comes Into Focus
XRP’s EMA lines are tightening and suggest a potential death cross may form soon—an indicator where the short-term EMA crosses below the long-term EMA, often signaling bearish continuation.
If this bearish crossover confirms, XRP could face increased selling pressure and test the key support level at $2.26.
A breakdown below that may open the door for a deeper drop toward $2.07, reinforcing the current downtrend.
 XRP Price Analysis. Source: TradingView.
However, if XRP manages to hold the $2.26 support and reverse momentum, it could attempt a move toward the $2.359 resistance level.
A successful breakout there might push the price to $2.479, and with strong buying pressure, even a run to $2.65 could be possible.
That said, XRP has remained under the $2.50 mark for the past 13 days, showing the challenge bulls face in reclaiming higher ground.
0
1


 Manage all your crypto, NFT and DeFi from one place
Securely connect the portfolio you’re using to start.

2
0


0
0

0
0