XRP at $2.10, Here is Why XRP is Crashing Today
0
0
XRP is trading near $2.10 amid growing market uncertainty, with traders monitoring key support levels. A potential head-and-shoulders breakdown and large whale transactions have raised concerns about the asset’s short-term direction.
Head-and-Shoulders Pattern Signals Bearish Outlook
A head-and-shoulders (H&S) pattern currently forms on the technical analysis chart of XRP which indicates an opposite trend from bullish. The left shoulder together with the head and right shoulder pattern appears on the 12-hour XRP/USDT chart while their neckline rests at $2.
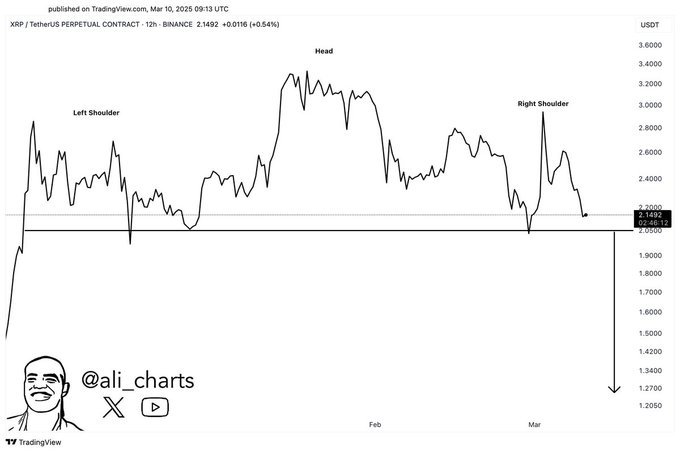
A breakdown below this support could trigger a price drop toward $1.30 – $1.20, based on the pattern’s projected move. As of press time, XRP was hovering around $2.13, and analysts warn that a daily close below $2 would confirm the bearish trend. However, if bulls step in, a rebound toward $2.40 – $2.60 remains possible.
Large XRP Whale Transaction Raises Questions
According to a recent Coinfomania report, a whale transferred 167,075,744 XRP, worth approximately $367 million, between unknown wallets. The transaction, detected by Whale Alert, occurred amid a price correction, drawing speculation from market participants.
XRP’s recent market performance elicits worry because its value dropped 3.23% during the previous day and fell by 10.73% throughout the previous week. Market participants currently debate if this price movement demonstrates a bearish trend or buying activities. XRP’s market value stood at $2.11 during the transaction period while market uncertainties rose.
Key Indicators Reflect Market Uncertainty
The Bollinger Bands on the 1-hour XRP/USDT chart indicate reduced volatility, with the price testing the middle band at $2.13. The lower band at $1.98 serves as support, while resistance is present near $2.20 – $2.25.
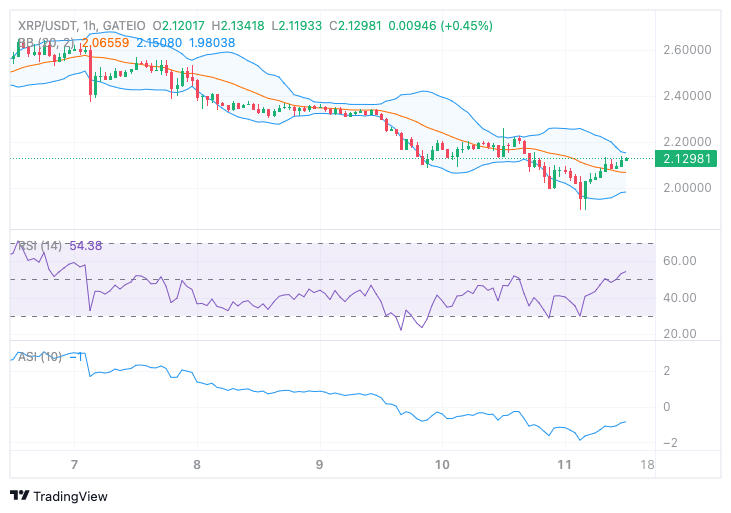
The Relative Strength Index (RSI 14) currently stands at 54.38 after showing signs of oversold conditions. The current RSI reading indicates a mixed market outlook since a failure to break through 60 RSI could force another price dip towards $2.05 to $2.00.
Meanwhile, the Accumulative Swing Index (ASI 10) shows bearish sentiment by staying below the zero line.
Market Participants Await Key Price Movements
XRP has a market cap value of $122.98 billion and a 24-hour trading volume of $7.81 billion representing an ongoing trading action. If XRP fails to stay above $2, it could break below to help traders read the next trend direction.
If XRP manages to sustain at the $2.10 – $2.20 mark, bullish sentiments may prevail. But a failure to defend this range could attract more selling pressure, which will lead to further price drops in the next few days.
The post XRP at $2.10, Here is Why XRP is Crashing Today appeared first on Coinfomania.
0
0

 Manage all your crypto, NFT and DeFi from one place
Securely connect the portfolio you’re using to start.


0
0

0
0
