
Solana Just Broke $100 After Months of Waiting. What Happens Next?

0
0

Solana price has finally broken above the $100 mark. This is a big deal because SOL has been stuck under this level for months.
The move came after a rally of more than 25% in just one week. It also lines up with fresh money flowing into Solana ETFs.
SOL was trading near $99.78 at last check, up over 5% on the day. Its market cap now sits at $58.06 billion, with a circulating supply of 583.37 million SOL out of a total supply of 632.85 million.
Traders are now asking if $100 can hold as support, or if this is just another short-term spike.
Why Is Solana Price Going Up Today?
A few things are driving Solana higher right now.
First, spot SOL ETFs pulled in $33.49 million in net inflows on August 24. That is the strongest daily inflow since December 2025.
The Bitwise Solana Staking ETF (BSOL) led the way with $25 million in new money. Daily traded volume across SOL ETFs also hit an all-time high of $166 million.
Second, network activity is breaking records. Solana processed more than 1.3 billion non-vote transactions last week. That beat the record set just seven days earlier.
Third, Solana has now beaten major centralized exchanges like Coinbase, Bybit, and Kraken in weekly DEX spot trading volume. This is the ninth week in a row that Solana has done this, and it now ranks second only to Binance.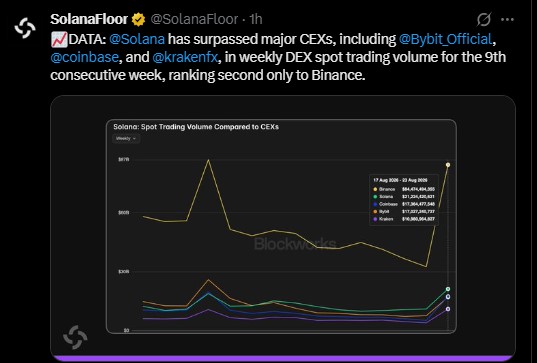
What Do the ETF Inflow Numbers Show?
The table below breaks down the latest SOL ETF data as of August 24, 2026.
ETF Name | Staking | AUM | Daily Flow | 24h Volume | Total Net Flow |
BSOL (Bitwise) | Yes | $769.79M | $25M | $108.66M | $953.86M |
GSOL (Grayscale) | Yes | $123.22M | $3.7M | $42.25M | $116.1M |
FSOL (Fidelity) | Yes | $156.27M | $4.8M | $11.1M | $200.81M |
VSOL (VanEck) | Yes | $18.62M | $0 | $2.7M | $20.32M |
SOEZ (Franklin) | Yes | $10.22M | $0 | $1.13M | $7.97M |
MSOL (Morgan Stanley) | Yes | $28.91M | $0 | $457.95K | $22.29M |
TSOL (21Shares) | Yes | $3.81M | $0 | $364K | -$96.41M |
SOLC (Canary Marinade) | Yes | $1.83M | $0 | $103.4K | $1.5M |
QSOL (Invesco Galaxy) | Yes | $4.63M | $0 | $57.34K | $3.13M |
All Issuers | - | $1.12B | $33.5M | $166.82M | $1.23B |
Most of the inflows came from BSOL alone. This shows big investors are leaning toward staking-enabled products right now.
Is Solana Outperforming Ethereum Right Now?
Yes, at least for the moment. The trading pair is up 4.72% during this latest rally.
This means Solana is gaining ground against Ethereum for the first time in this market cycle. Some traders see this as a sign that money is rotating out of ETH and into SOL.
It is too early to call this a lasting trend. But it is worth watching in the coming weeks.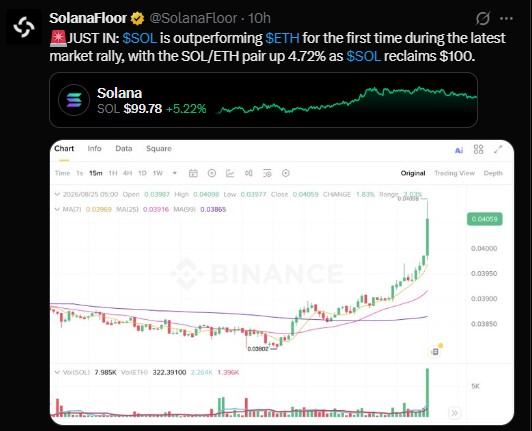
What Do Solana's Derivatives Markets Show?
Solana's futures market is heating up alongside the price move.
Futures volume over 24 hours jumped 79.34% to reach $15.85 billion. Open interest, which tracks the value of open futures contracts, rose 11.08% to $6.61 billion.
Liquidations have also picked up. Over the past 24 hours, $24.70 million in positions were wiped out. Of that, $16.76 million came from short sellers who bet against SOL, while $7.94 million came from long traders.
Interestingly, in the shorter one-hour and four-hour windows, long liquidations were higher than shorts. In the last hour, $1.18 million in longs were liquidated against just $24.61K in shorts.
Over four hours, longs lost $3.30 million versus $306.25K in shorts. This points to choppy, fast-moving price action inside the bigger uptrend.
Options activity is climbing too. Spot volume over 24 hours came in at $1.88 billion, while options volume jumped 26.84% to $21.17 billion and options open interest rose 4.36% to $143.57 billion.
Sentiment across exchanges leans mixed to slightly bearish by account count. The overall long/short ratio sits at 0.9996, close to even. On Binance, the SOL/USDT long/short account ratio reads 1.751, while OKX shows 1.53. Among Binance's top traders, the account ratio is 1.9274, and the position-based ratio is 2.1757, suggesting larger traders are leaning more heavily long than the broader market.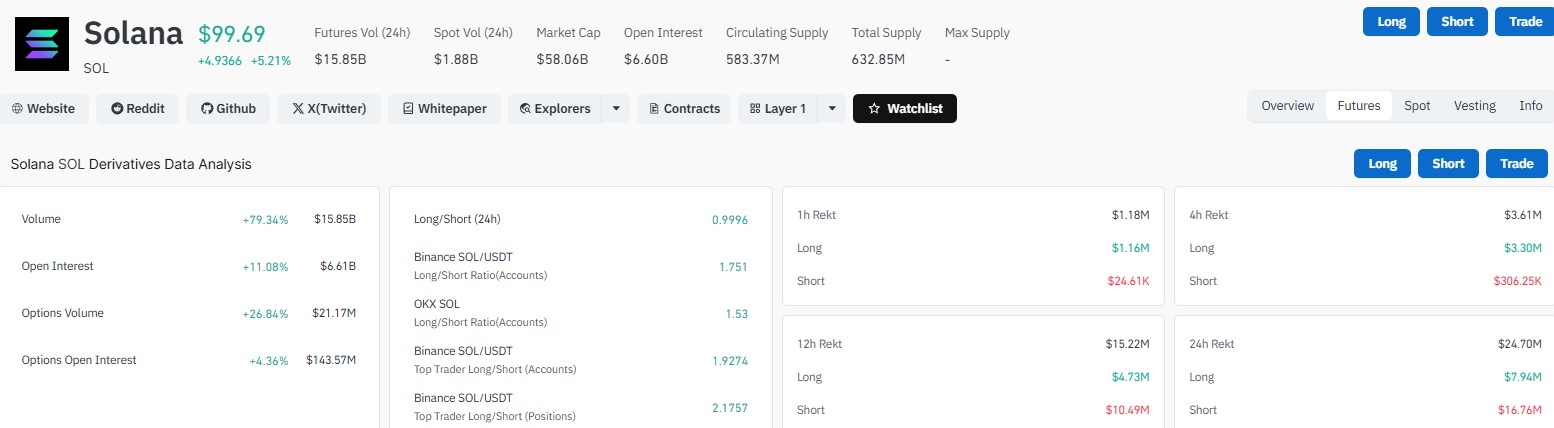
Solana Price Prediction: What Do the Charts Say?
The daily chart shows Solana breaking out of an eight-month sideways range.
On the daily candle, SOL opened at $98.99, hit a high of $103.00, dipped to a low of $98.57, and closed at $99.78, up 0.82% on the day, with volume of 152.03K on KuCoin.
SOL rose from a June low near $60 and has now cleared the $98 to $100 resistance zone that has capped price since January.
The moving averages back up the bullish case. SOL is trading above its 20-day EMA at $85.00, 50-day EMA at $80.05, 100-day EMA at $80.13, and 200-day EMA at $89.45.
That stacked EMA order is generally seen as a healthy bullish signal.
If SOL can hold the $98 to $100 zone as new support, the chart pattern points to a possible move toward $110 to $120. A continued push higher could open the door to $130 to $135, though that is not guaranteed.
On the flip side, the Relative Strength Index (RSI) is sitting around 87. That is deep into overbought territory, so a pullback would not be surprising.
A dip toward $95 to $100, or even the $89 to $90 zone, could happen before Solana makes its next move higher. A daily close below $85 would weaken this bullish setup and put the $80 support area back in focus.
Network Upgrades Add to the Bullish Case
Beyond price action, Solana's technology roadmap is also progressing.
The Agave 4.2 upgrade is now live on mainnet. It brings larger transaction capacity and starts a phased cut to slot times, moving from 400 milliseconds toward 200 milliseconds as more features activate.
Looking further ahead, Solana is preparing for Alpenglow, a new consensus upgrade aimed at roughly 150-millisecond finality. Mainnet activation is expected sometime in the third quarter of 2026.
Faster finality and higher throughput could support demand for the network over time, especially if trading and DeFi activity keep growing.
Key Levels to Watch
Resistance: $100, then $110 to $120, with $130 to $135 as a stretch target
Support: $95 to $100 first, then $89 to $90, with $80 as a deeper support zone
Momentum signal: RSI near 87 suggests overbought conditions and possible short-term cooling
Final Thoughts
Solana's break above $100 is a meaningful technical event after months of sideways trading. Rising ETF inflows, record network activity, and Solana's growing share of DEX trading volume all point to strengthening demand.
At the same time, an RSI near 87 is a warning sign that the market may be stretched in the short run. A cool-off or pullback would not undo the bigger bullish structure unless SOL closes back below $85.
Traders watching Solana price action will likely keep an eye on whether $100 holds as support over the coming days and weeks.
Disclaimer
This article is for informational purposes only and should not be considered financial or investment advice. Cryptocurrency markets are highly volatile, and prices can rise or fall sharply within short periods. Always do your own research and consult a licensed financial advisor before making any investment decisions.
0
0

 Manage all your crypto, NFT and DeFi from one place
Securely connect the portfolio you’re using to start.


