JPMorgan Gives Bold Nvidia Stock Price Target, But Market’s Not Buying It

0
0

NVIDIA Stock just delivered a record-breaking Q4 with $68.1 billion in revenue, 73% year-over-year growth, and earnings per share of $1.62 that crushed estimates. JPMorgan, among others, wasted no time raising its price target from $250 to $265.
Yet on February 26, the stock fell nearly 7% from its session high of $197 to under $185. The results are undeniable. But the price action, the money flow, and the institutional behavior tell a very different story. At least, for now.
The Numbers Look Bulletproof, Until You Look Closer
NVIDIA’s Q4 numbers speak for themselves. Revenue hit $68.1 billion, up 73% year-over-year. The data center segment alone pulled in $62.3 billion, making up 91% of total revenue. EPS (Earnings Per Share) of $1.62 beat the $1.53 consensus by nearly 6%.
And the Q1 FY2027 guidance of $78 billion blew past Wall Street’s $72.8 billion estimate — a figure that notably excludes any revenue from China.
JPMorgan analyst Harlan Sur responded by lifting the Nvidia price target from $250 to $265.
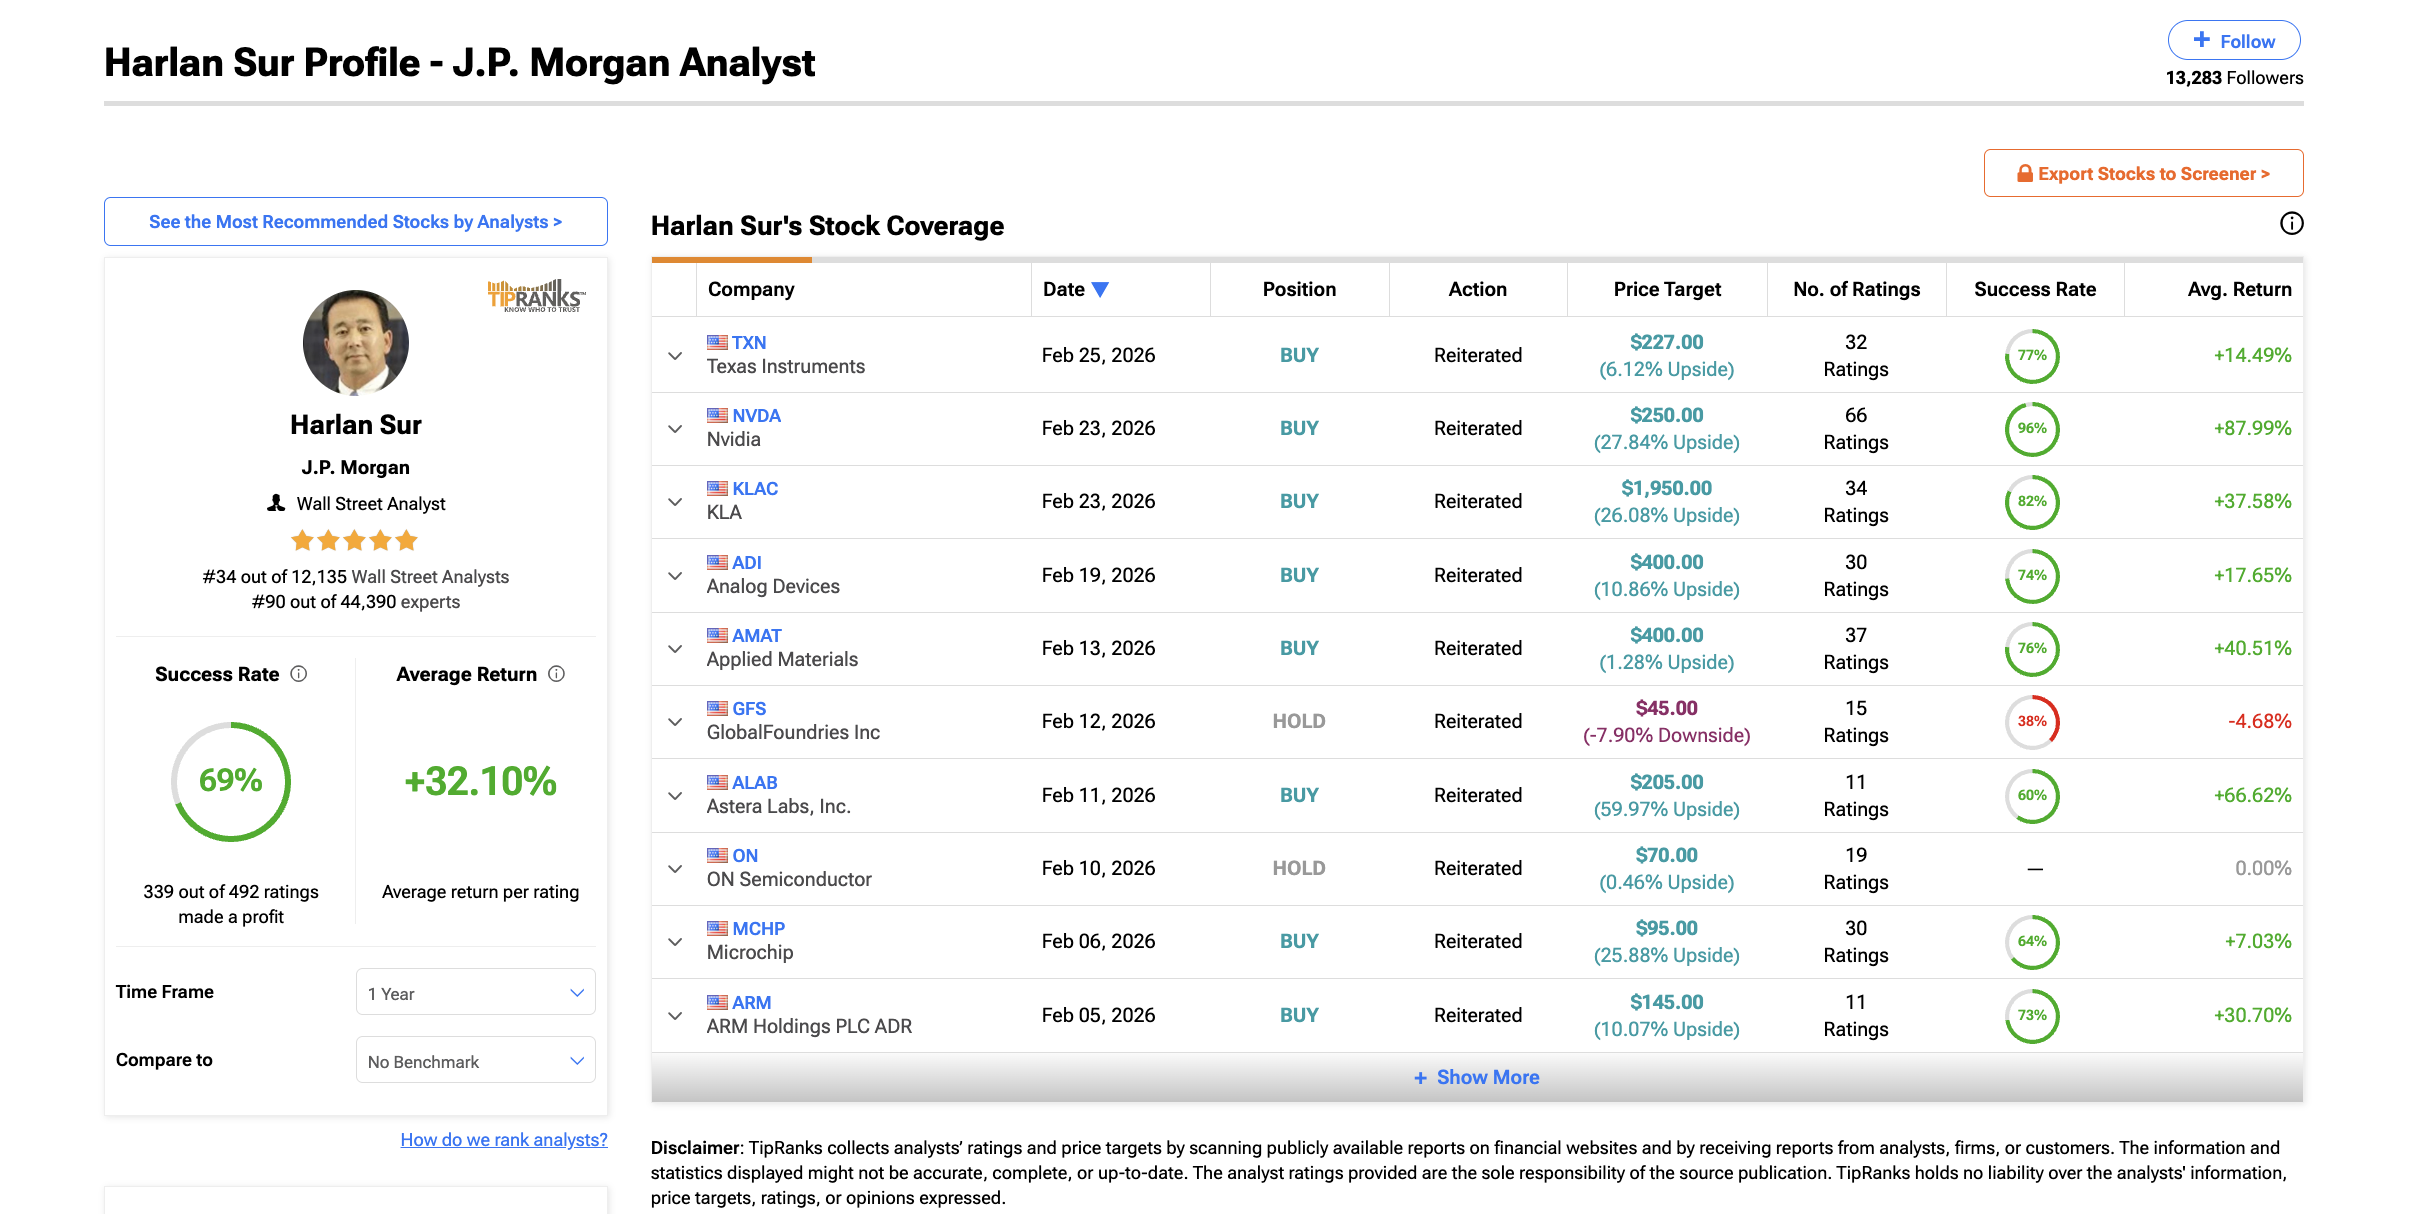 Initial Call For NVIDIA Stock: TipRanks
But here is what most analysts are not highlighting. NVIDIA’s quarter-over-quarter growth rate is quietly decelerating. Q3 grew 22% over Q2. Q4 grew 19.5% over Q3.
The Q1 guidance implies roughly 14.5% sequential growth. Revenue keeps hitting records, but the pace of acceleration is fading. For a stock priced on growth momentum, this distinction matters. Something big money might be watching.
There is also the question of who is actually driving this revenue. Deepwater Asset Management’s Gene Munster estimates that roughly 70% of Nvidia’s revenue comes from just 8 companies.
CFO Colette Kress confirmed that the top 5 hyperscalers (cloud computing providers) account for slightly over 50% of data center revenue. That level of customer concentration means that even a modest 10-15% reduction in AI capex from a few major buyers could translate into billions in lost quarterly revenue.
It is also worth noting that JPMorgan’s asset management division is itself a significant institutional holder of Nvidia.
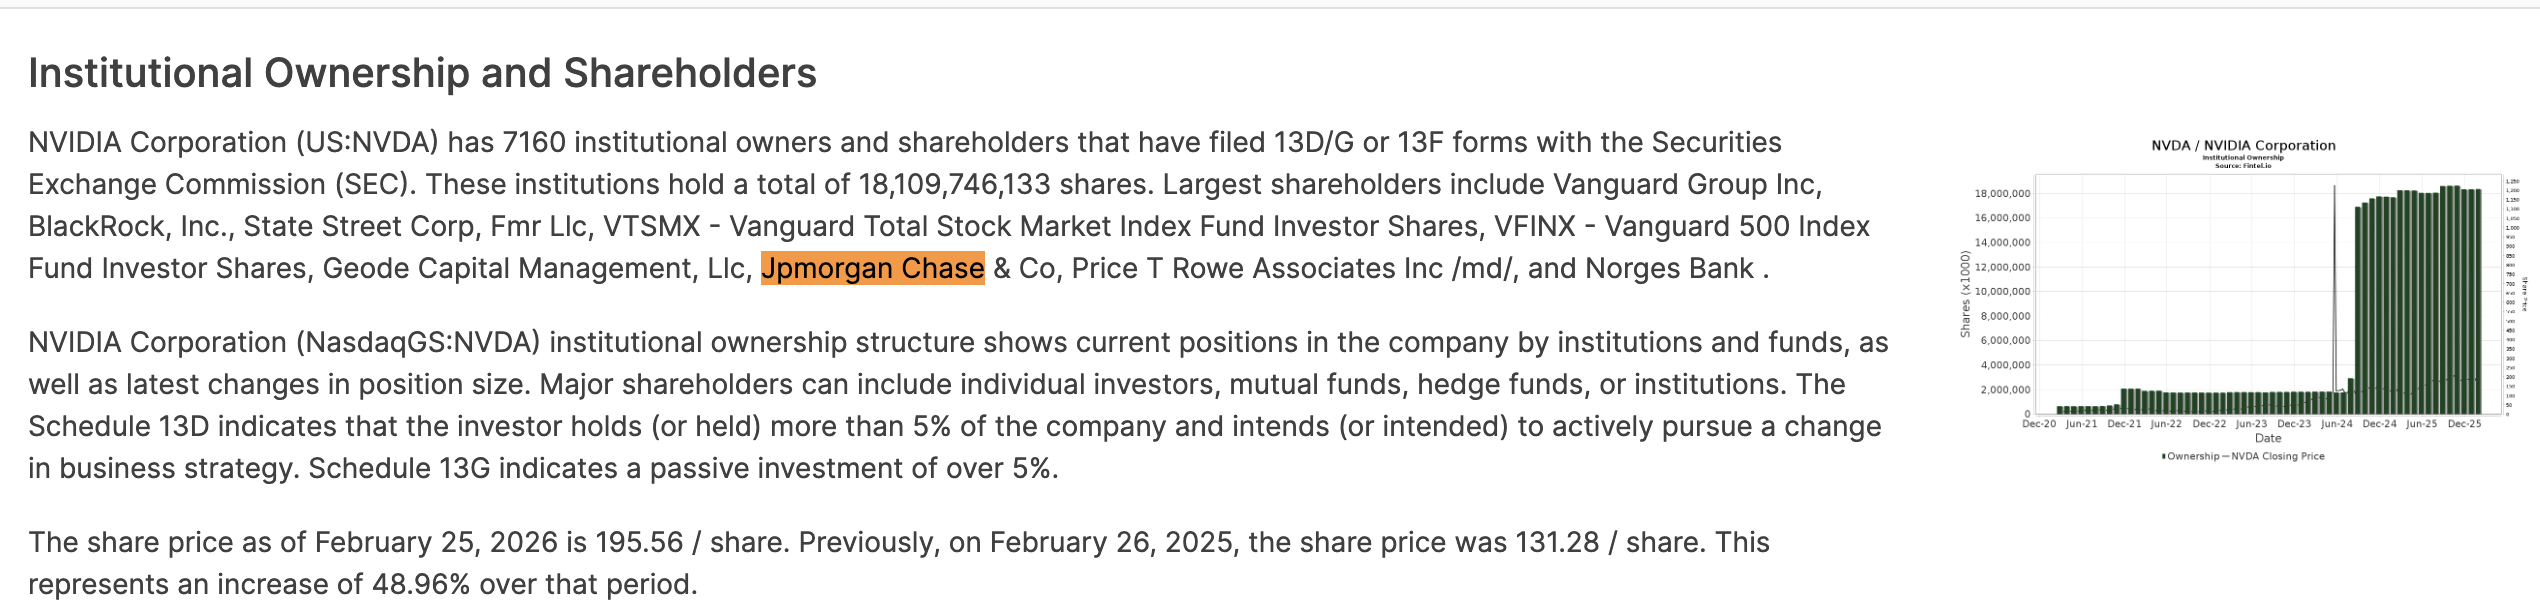 JPMorgan Holds: Fintel
This is standard on Wall Street, but it is a context that retail investors should be aware of when evaluating the bullishness behind a price target upgrade.
What Retail NVDA Investors See vs What Institutions Are Doing
On-Balance Volume (OBV), an indicator that tracks cumulative buying and selling pressure by adding volume on up days and subtracting it on down days, tells a positive story on the surface.
OBV has maintained higher highs throughout Nvidia’s 3-month consolidation, suggesting retail-driven buying pressure remains consistently positive. However, it still needs to break past its ascending trendline resistance to confirm genuine broad-based strength.
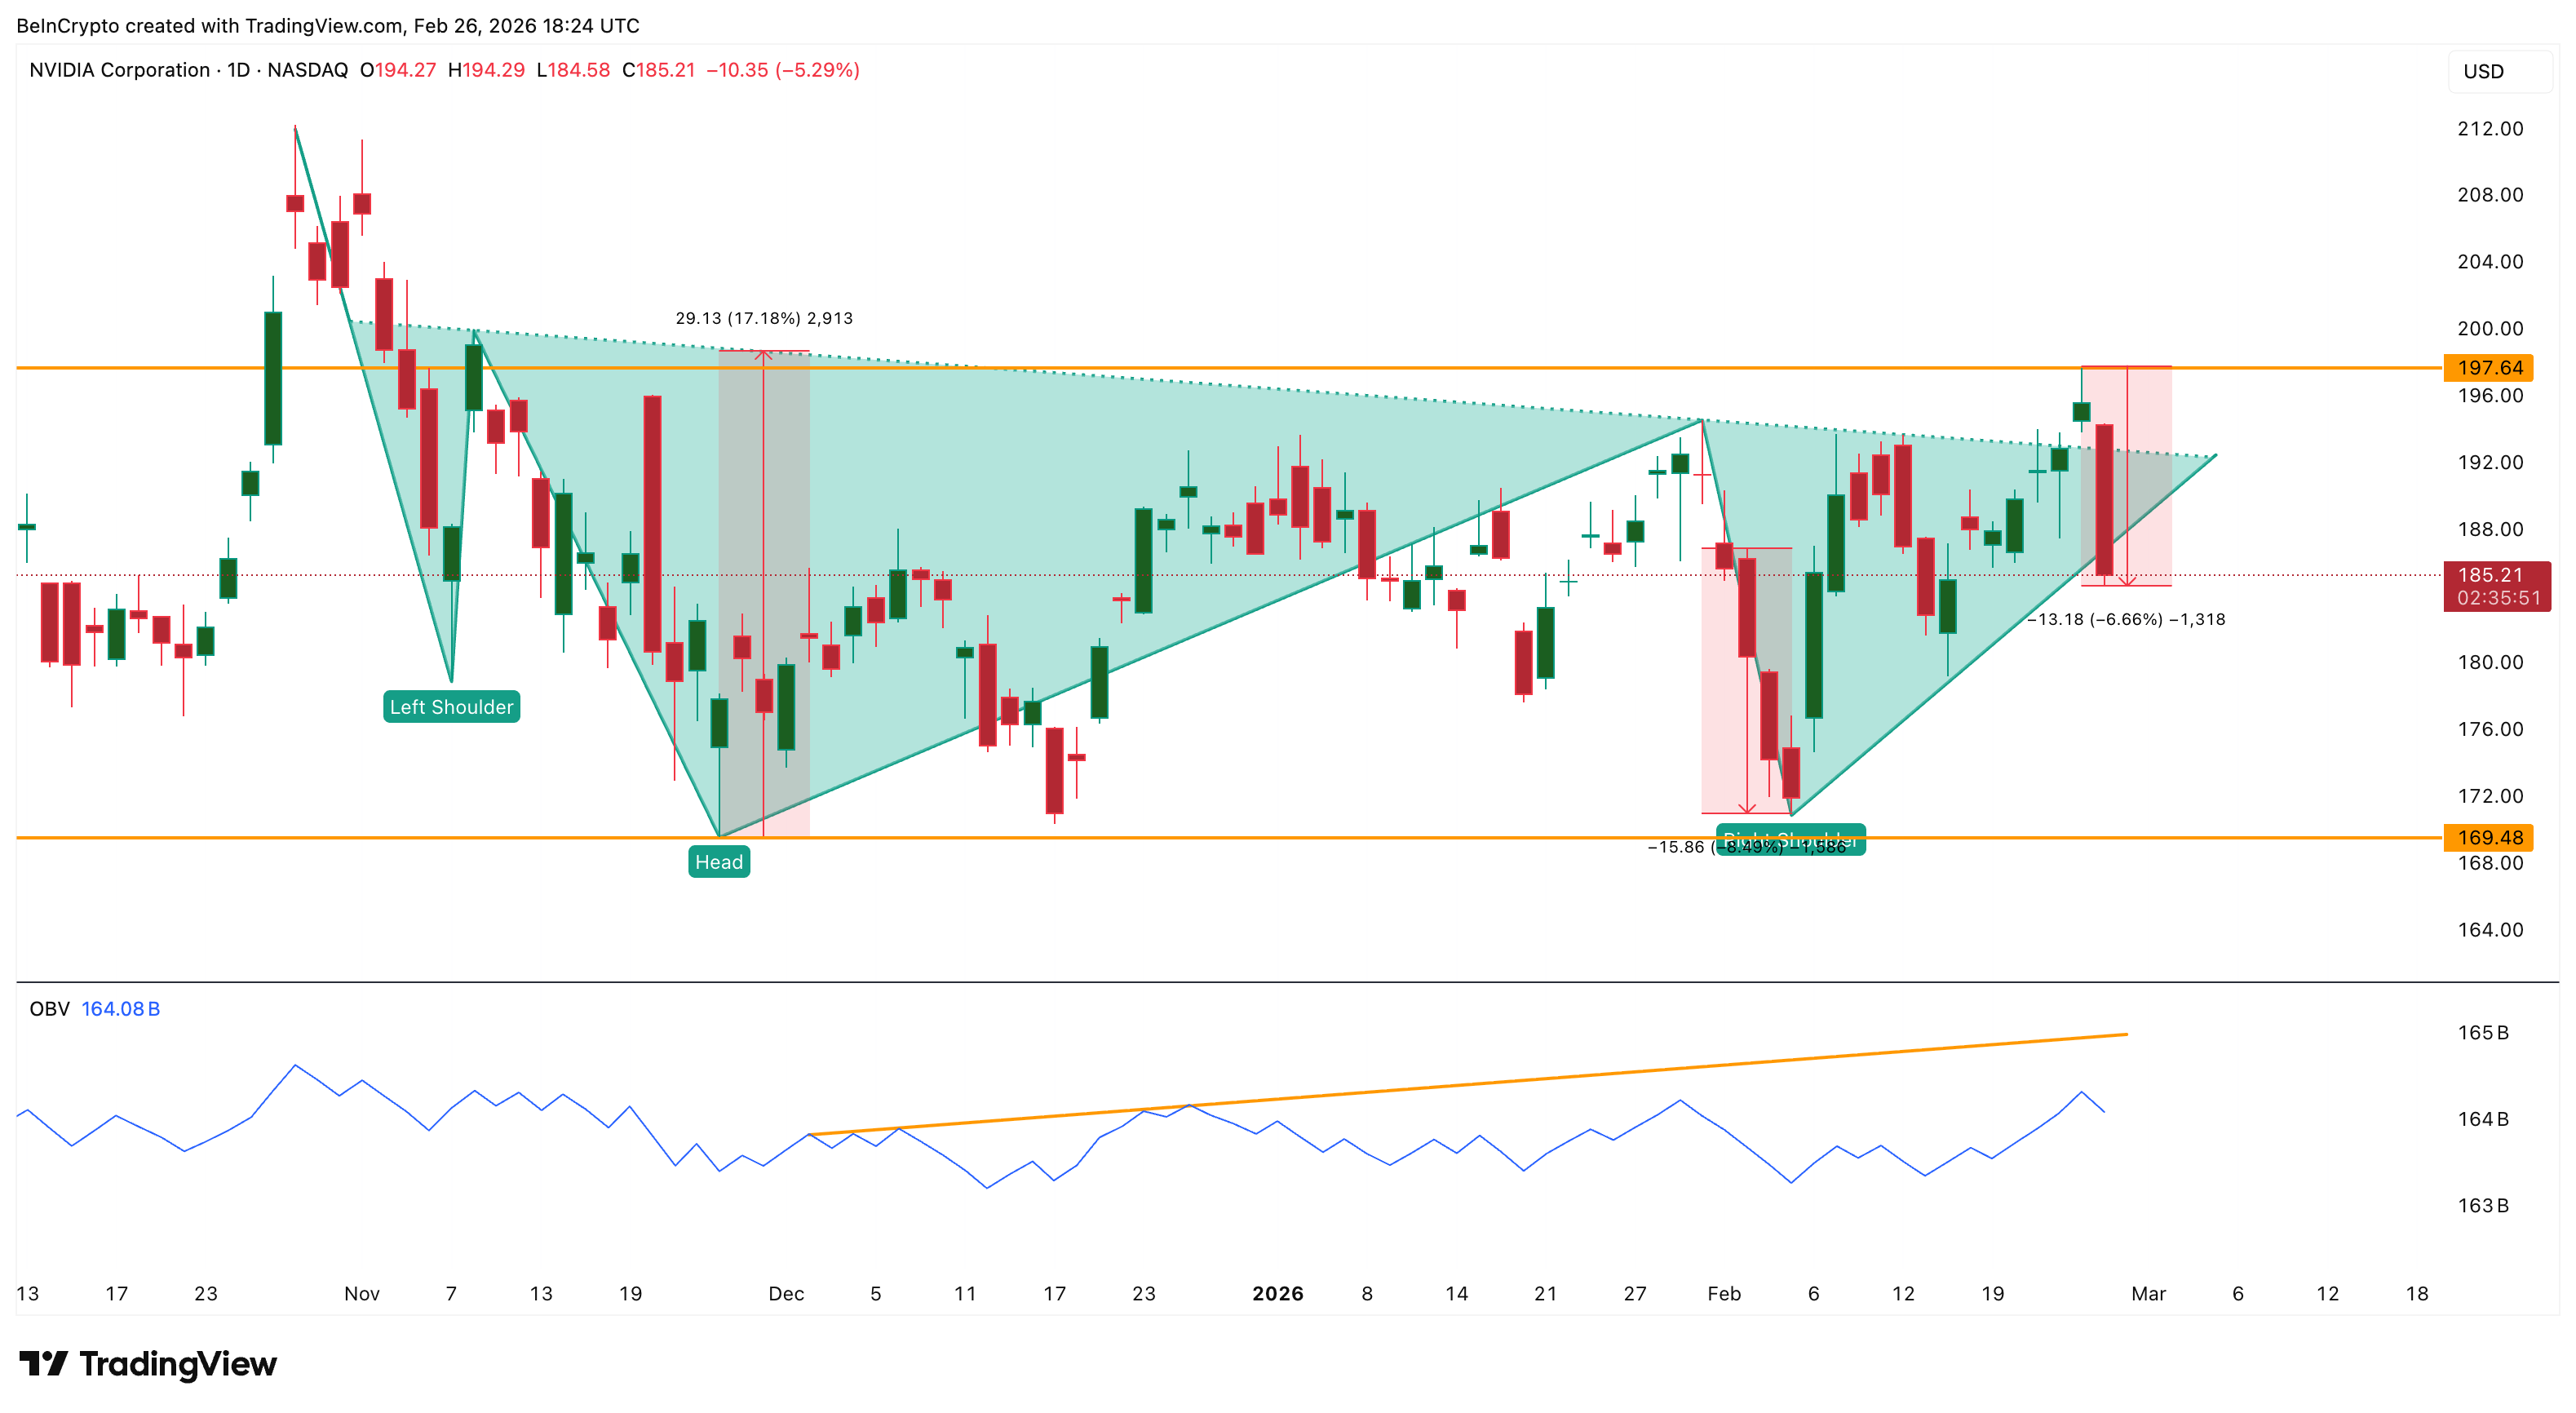 NVIDIA OBV: TradingView
The most recent 13F filings (quarterly reports large investors must file with the SEC revealing their positions) for Q4 2025 show a dramatic shift in institutional sentiment.
Net institutional money flow surged to approximately $149 billion in purchases against $36 billion in sales — a net inflow of roughly $113 billion. That is a massive improvement from Q3, where institutions bought $38 billion and sold $34 billion, leaving a net inflow of just $4 billion.
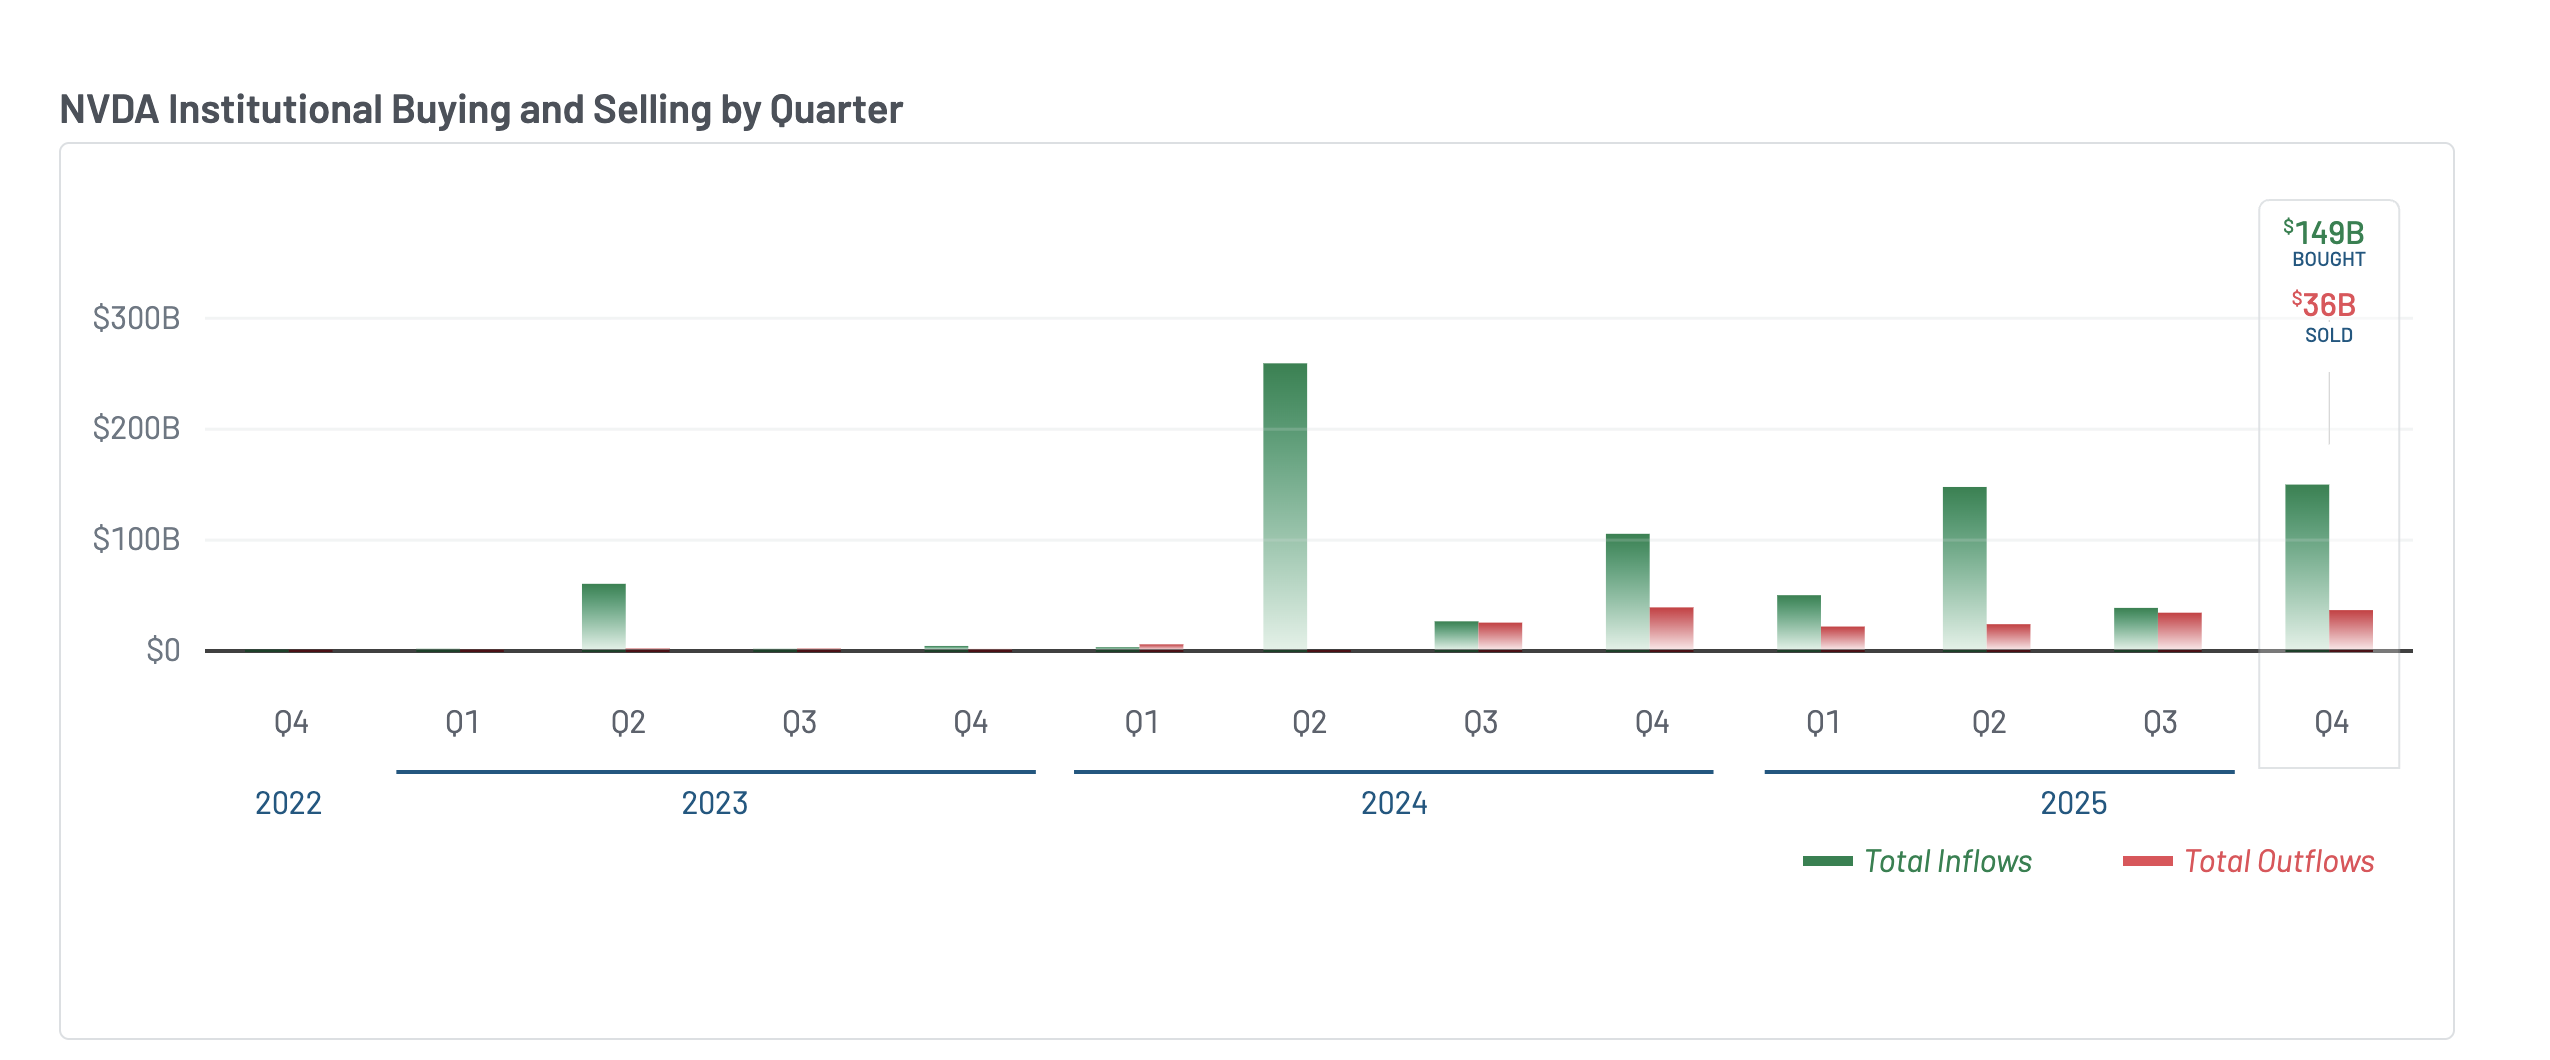 NVIDIA Q4 Institutional Flows: Market Beat
Yet despite this wall of institutional money entering NVDA in Q4, the stock barely moved — trading sideways for most of the period. That suggests institutions were accumulating, but supply from insiders and earlier holders absorbed the demand. NVIDIA director Mark Stevens sold approximately $40 million in shares in December.
Bank of America, while slightly increasing its equity stake, closed out both its call and put options positions entirely — neutralizing its directional bets.
Institutions are clearly positioned. But the hedging and the flat price despite massive inflows suggest they are bracing for something. The next section explores what that might be.
The Risk Hiding in the Charts
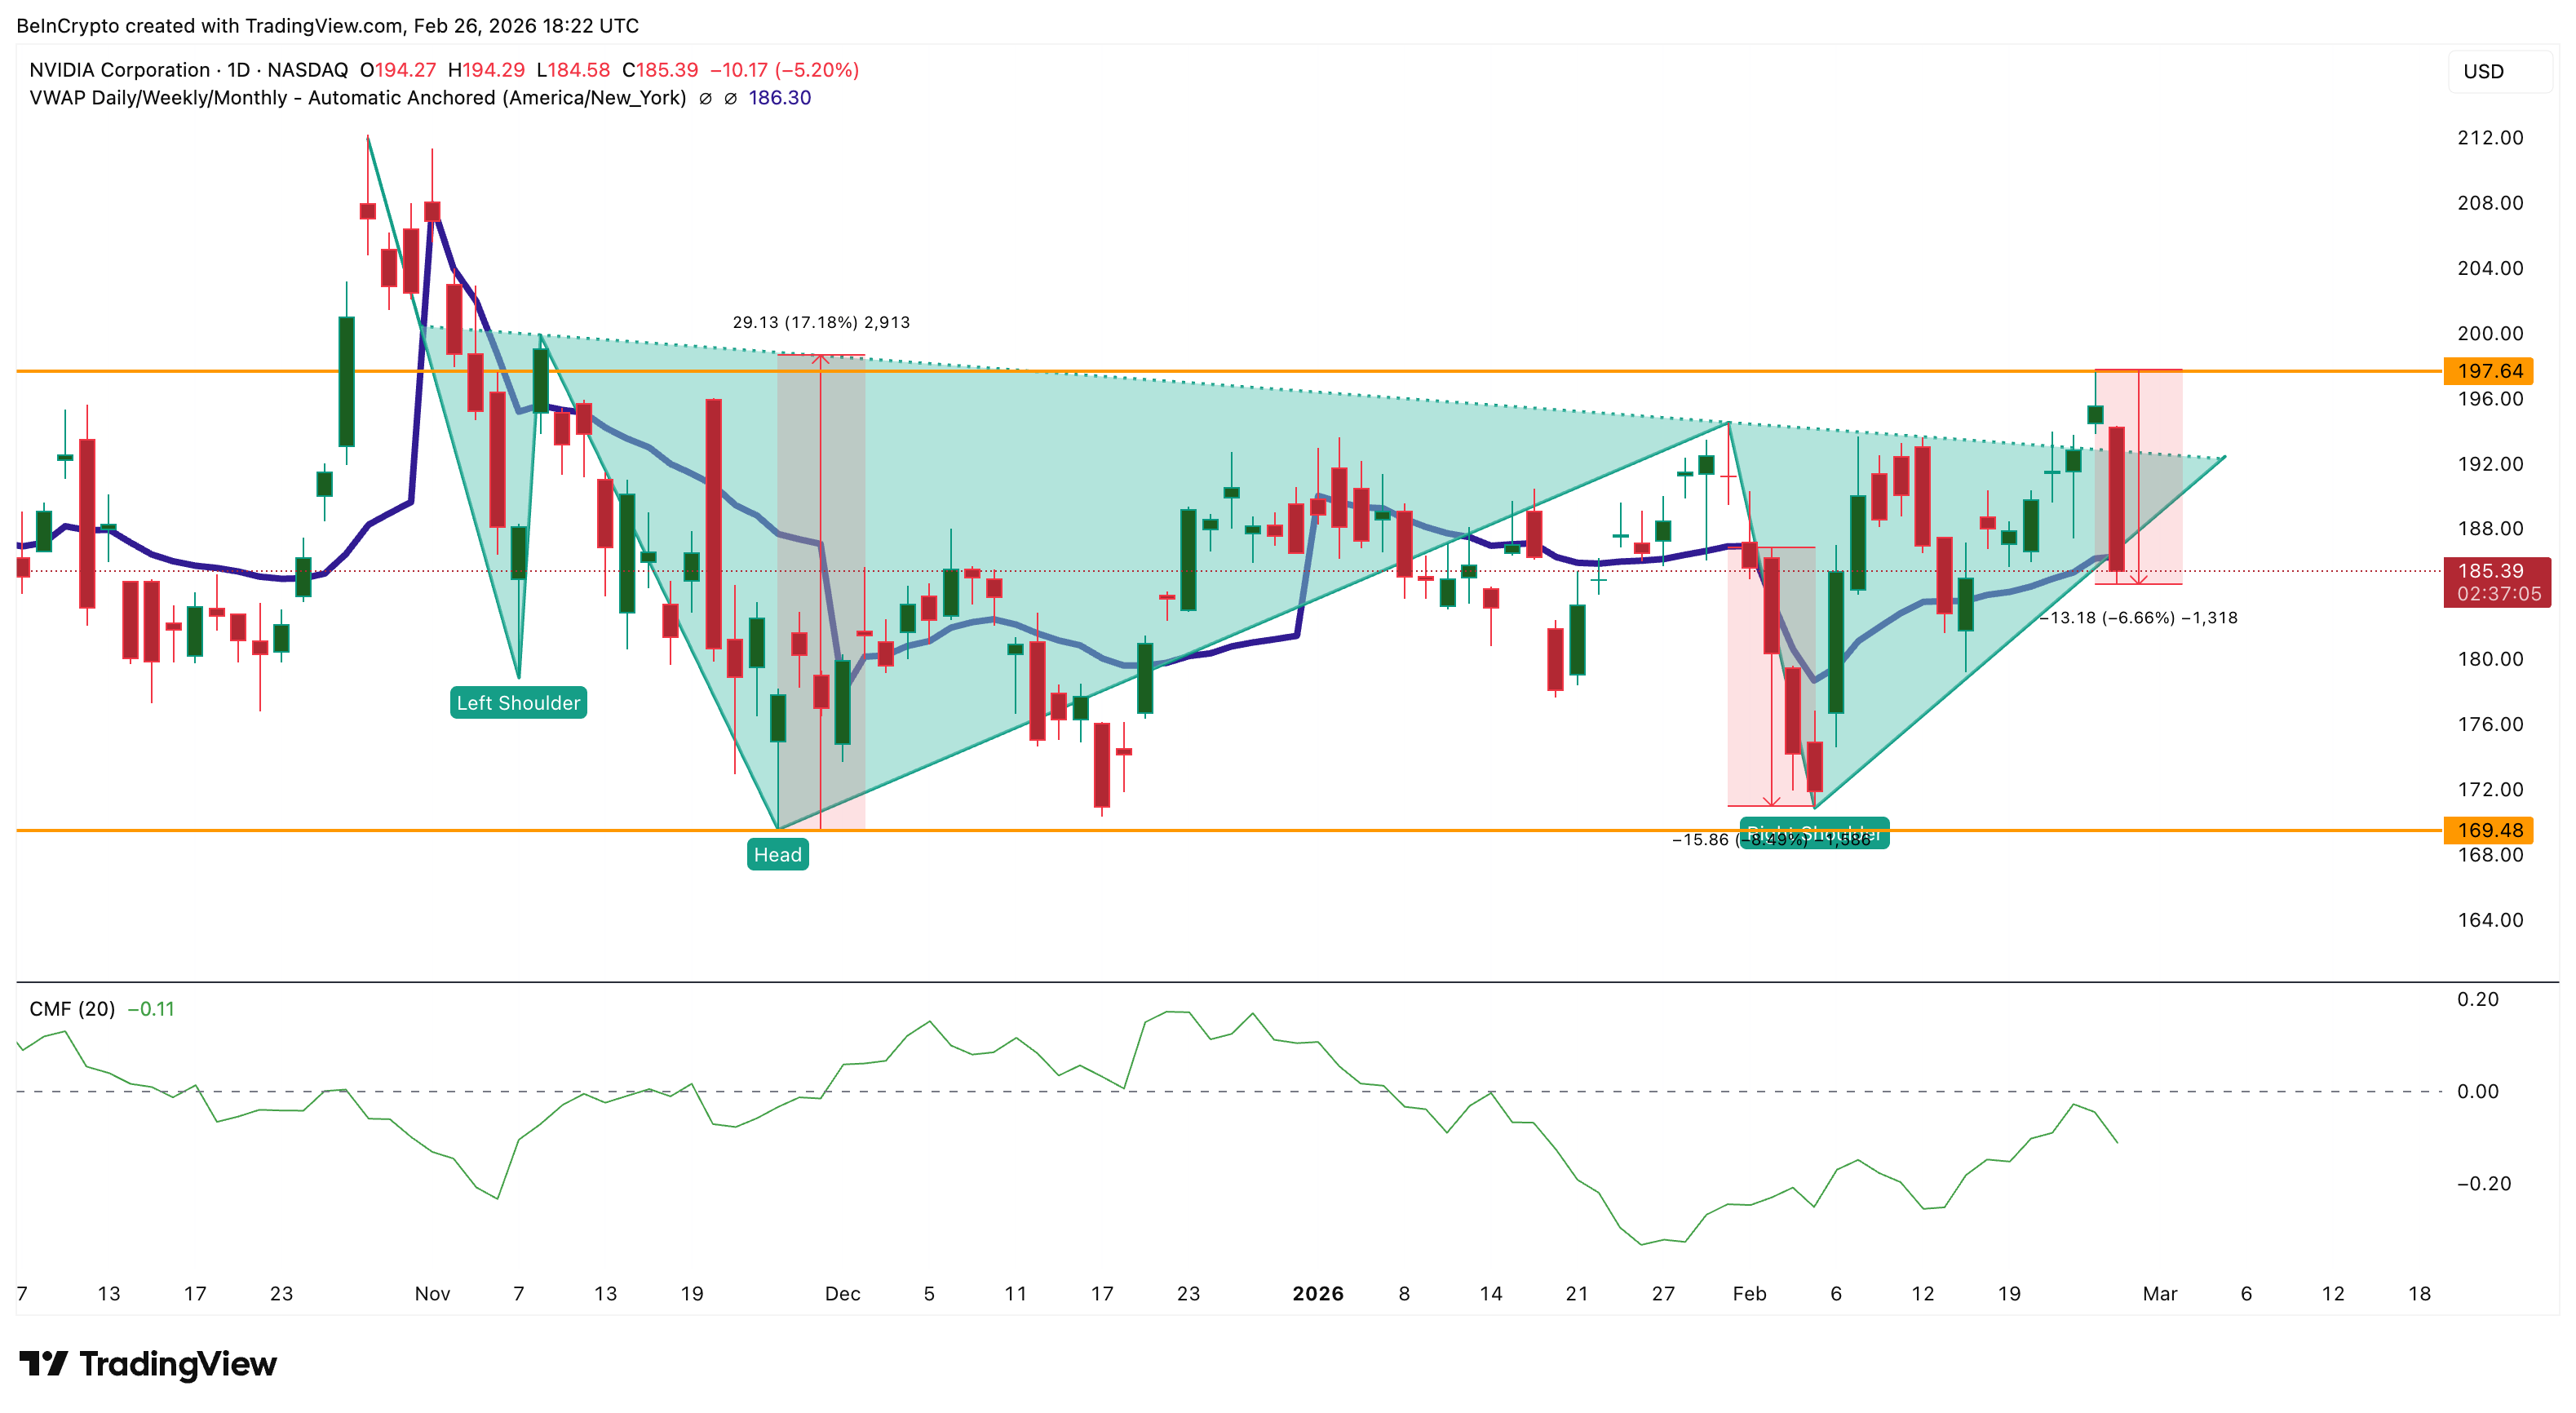
The Chaikin Money Flow (CMF), an indicator that measures whether money is flowing into or out of a stock based on where the price closes within its daily range weighted by volume, reveals what the earnings headline does not.
Since February 5, as the right shoulder of Nvidia’s inverse head and shoulders pattern formed, CMF climbed steadily alongside the price. It rose all the way into the February 25 earnings breakout when Nvidia briefly touched $197.
Then on February 26, as the stock reversed sharply to $185, CMF plunged.
That sudden collapse suggests the money flowing in during the rally was speculative positioning — not committed institutional capital — and it evaporated the moment the breakout failed. And based on what we discussed earlier, revenue deceleration could be a reason.
The monthly VWAP (Volume Weighted Average Price, which approximates where institutions have built their positions) reinforces this. NVIDIA had been trading above its monthly VWAP since breaking out on February 17.
The last time Nvidia broke below the monthly VWAP was on January 30, which led to a correction of approximately 8.5% by early February.
 Key Institutional Chart: TradingView
As of February 26, the stock has once again fallen below this line. This means recent institutional buyers are now underwater, which historically triggers further selling as stop losses unwind.
The technical breakdown has context. Michael Burry flagged today that Nvidia’s supply commitments have ballooned to levels that mirror Cisco before the dot-com bust — a company that wrote down billions when demand didn’t meet expectations.
CFO Kress acknowledged Nvidia has locked in inventory “further out in time than usual.” Bulls like BofA’s Vivek Arya argue this secures Nvidia’s dominance. But CMF collapsing and VWAP breaking on the same day suggests the market isn’t waiting to find out who’s right.
The NVIDIA Stock Price Levels That Decide What Happens Next
The charts, the money flow, and the institutional positioning all point to the same conclusion — $195 is where conviction gets tested, a level highlighted later on the chart. But first, the risk.
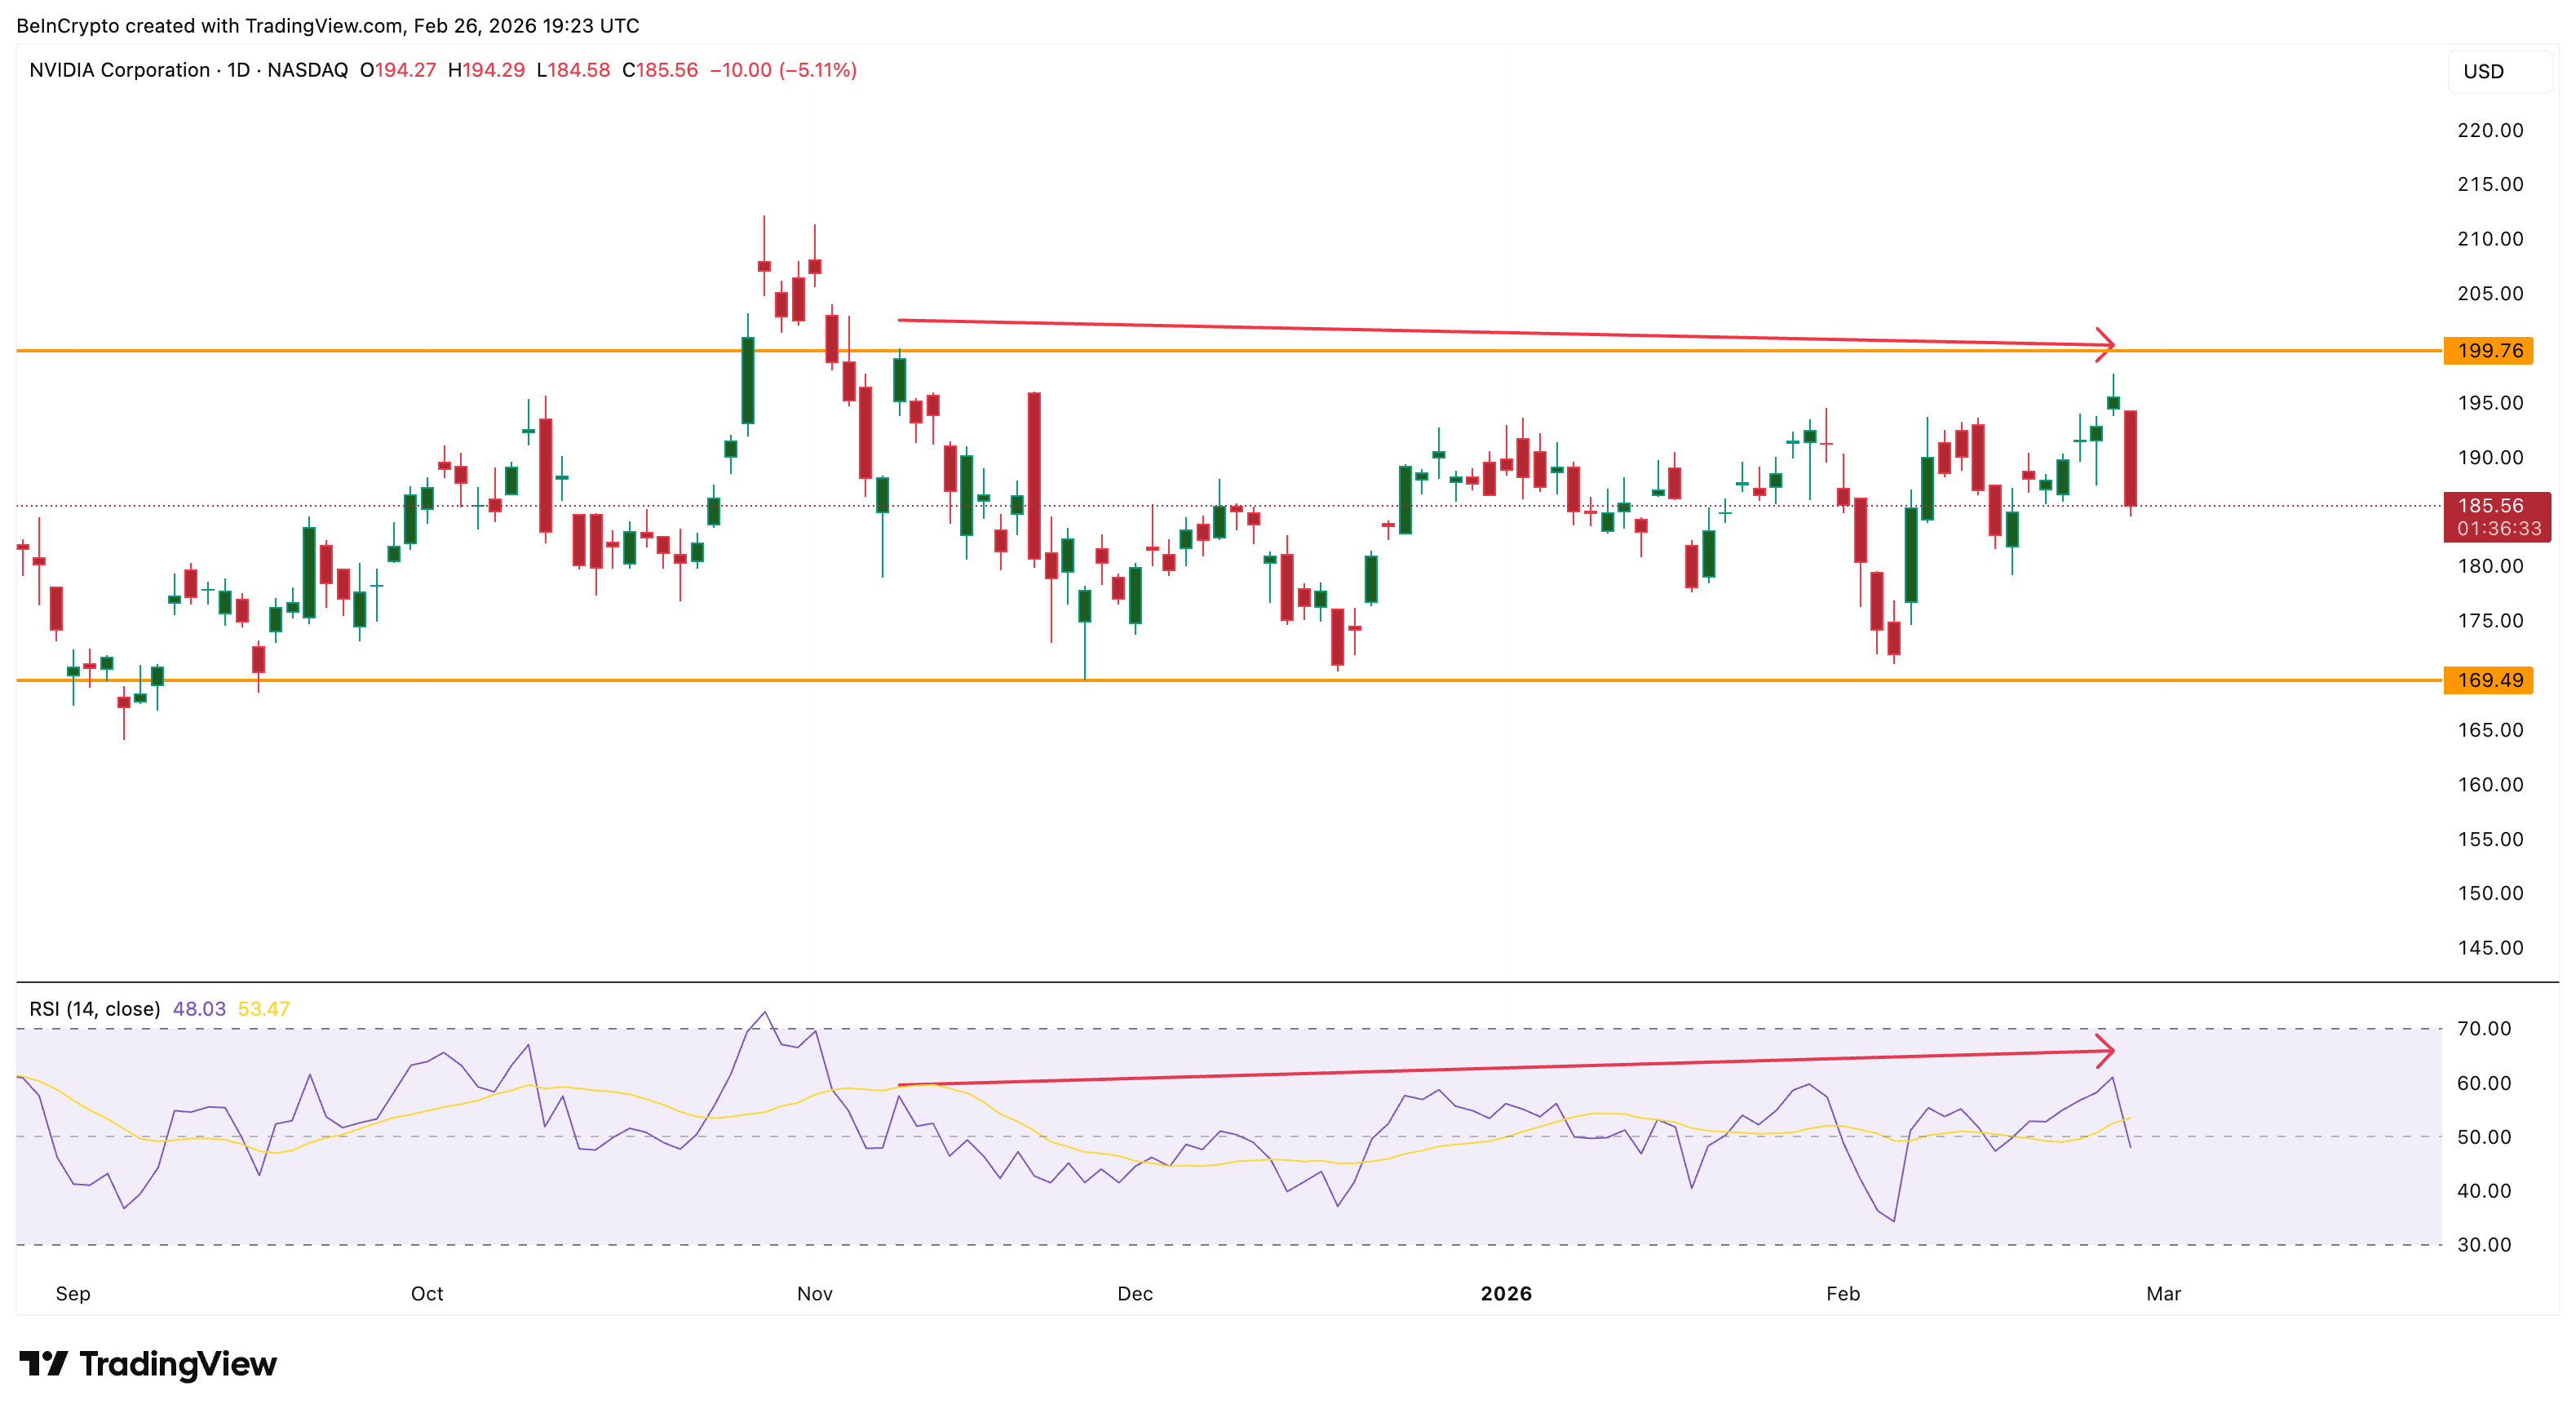
On the daily chart, a hidden bearish divergence has formed between November 10 and February 25. During this period, the NVIDIA stock price made a lower high while the Relative Strength Index (RSI), a momentum indicator, made a higher high
 Bearish Divergence: TradingView
It is a signal that upward momentum is quietly fading even as the stock appears to hold its range.
Since that November divergence started developing, Nvidia has been locked between $169 and $199. It couldn’t break out of this consolidation despite multiple attempts — including the inverse head-and-shoulders breakout on February 25, which failed within 24 hours.
 NVDA Price Analysis: TradingView
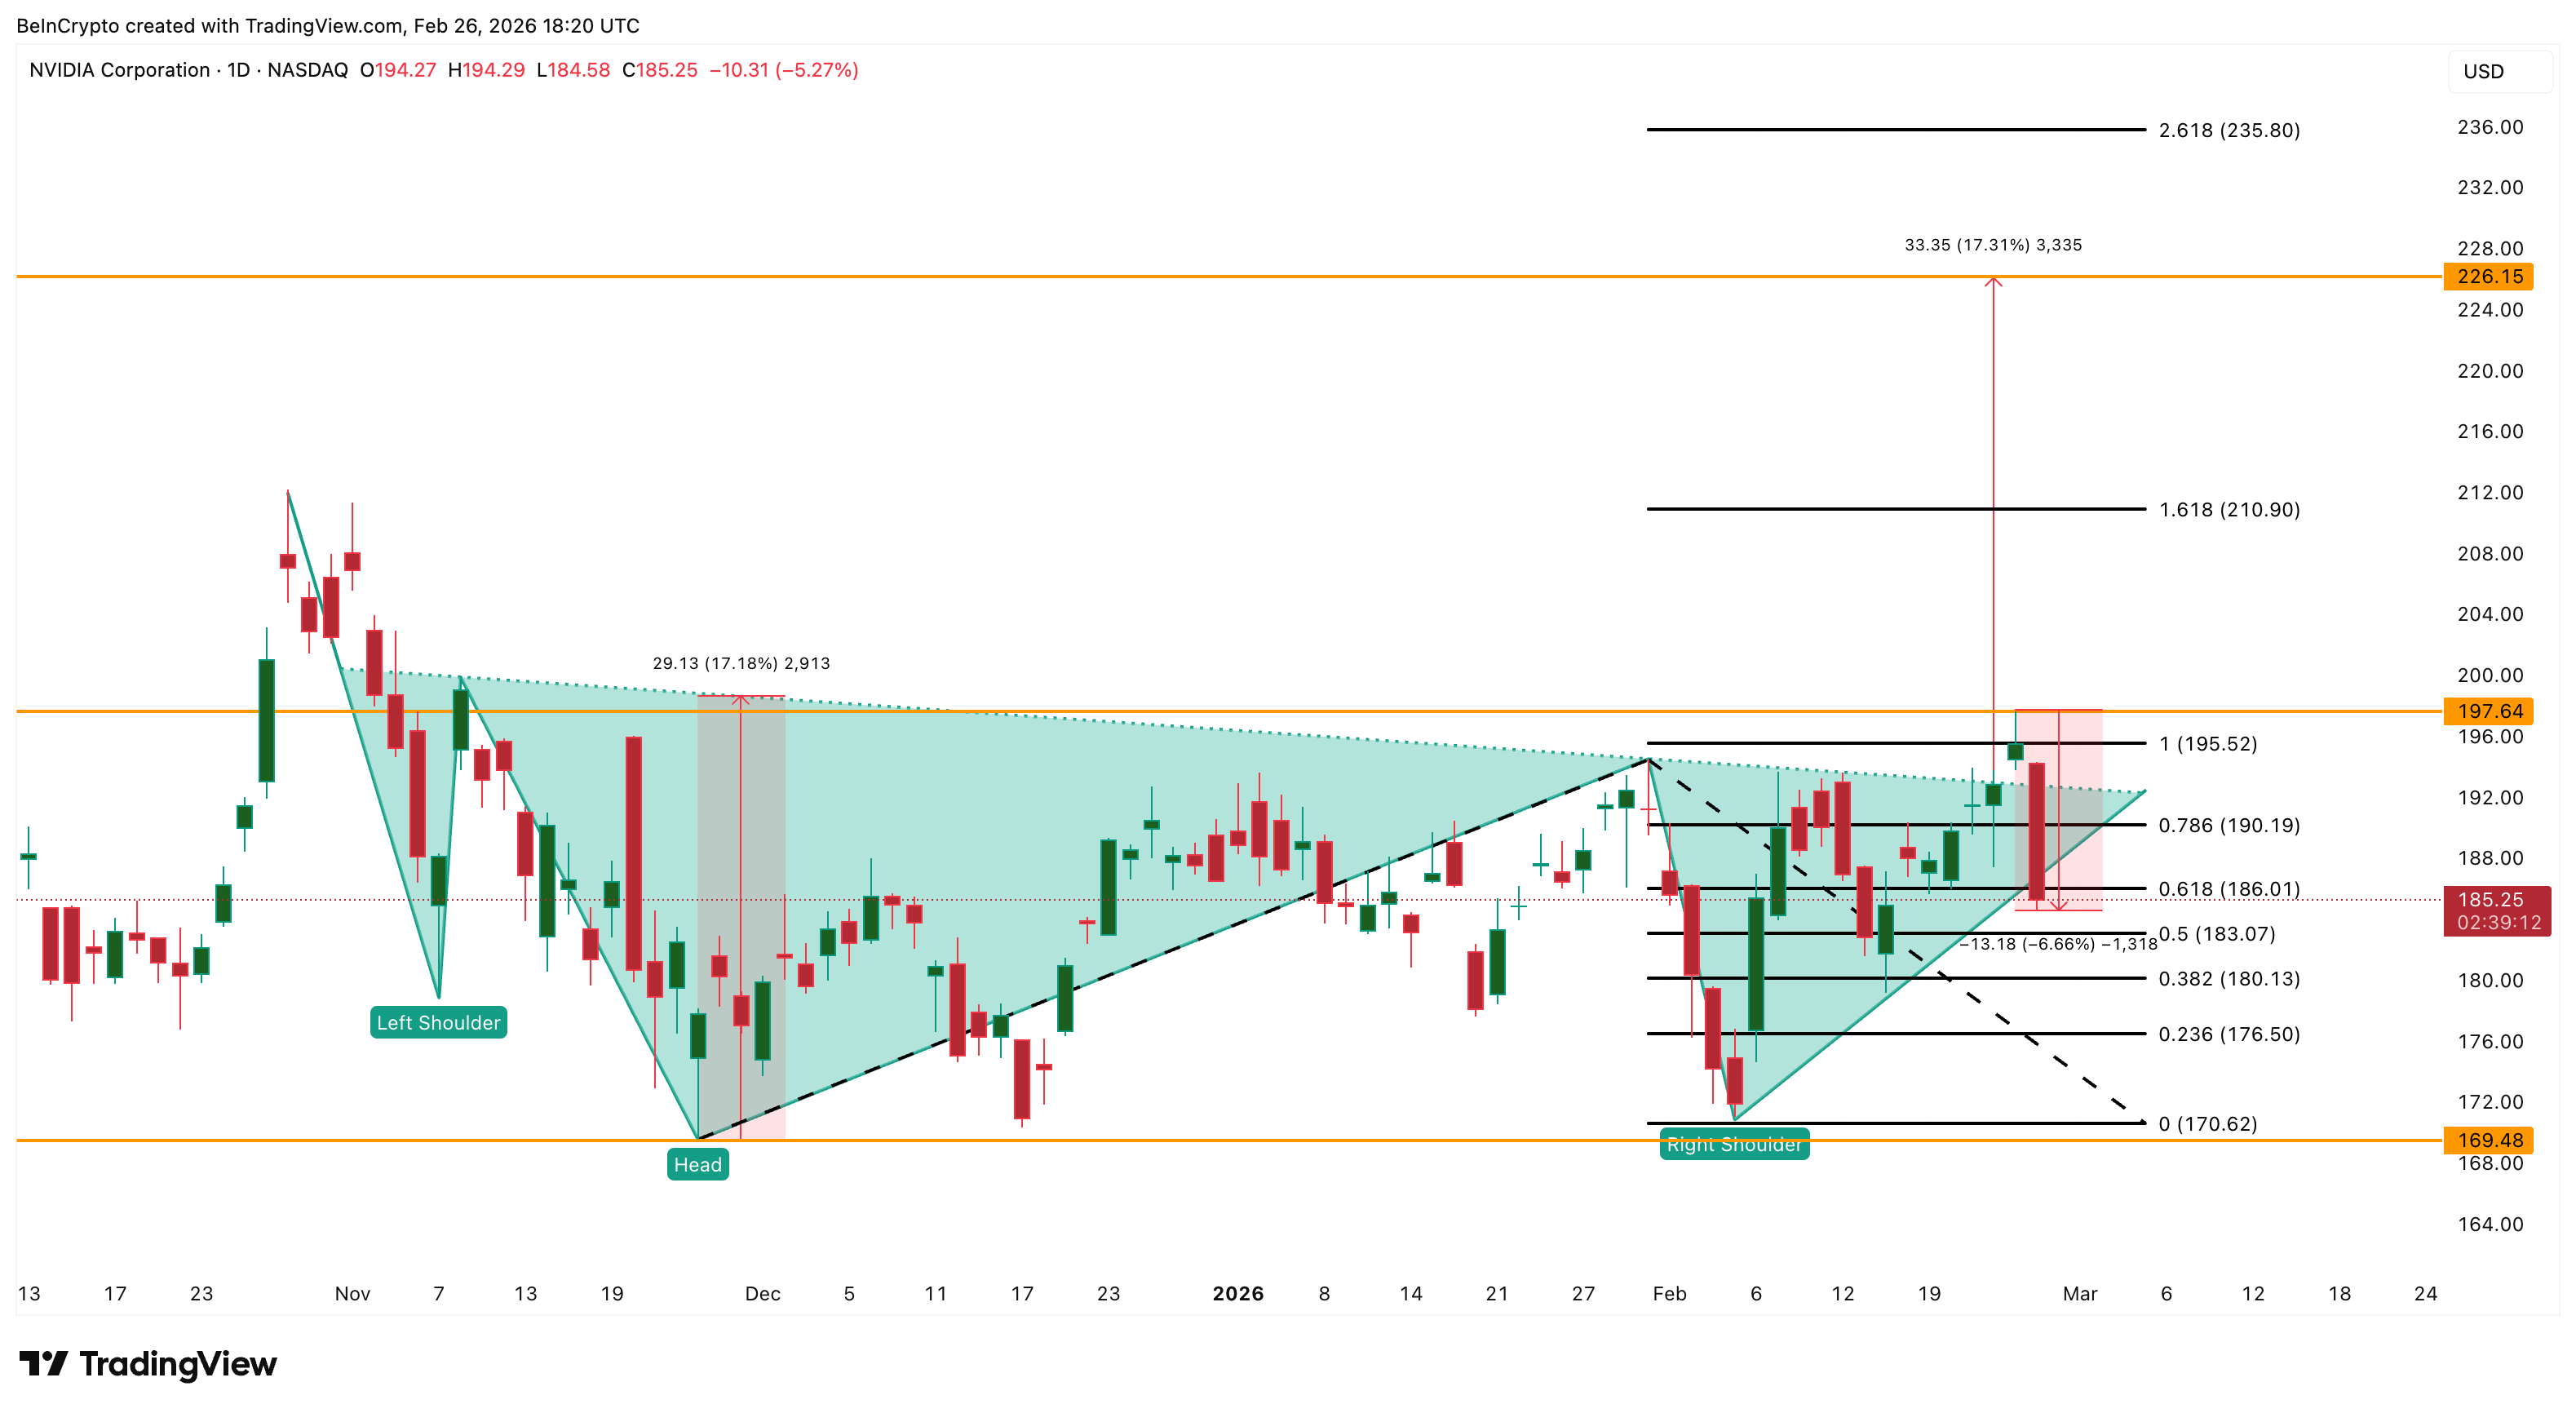
The Fibonacci extension levels from the pattern now frame what comes next. On the downside, $183 at the 0.5 level is the immediate support. Below that, $180 at the 0.382 level becomes critical — a break there exposes $170, the right shoulder low, and $169, the head. Those levels would invalidate the pattern entirely.
On the upside, the neckline at $195 remains the key resistance and the conviction tester. A clean daily close above it, which the NVIDIA stock failed to do yesterday, is needed to reactivate the pattern.
That could push it towards the projected target at $226, the full head-to-neckline measurement.
The next extension at $235 brings it closer to JPMorgan’s $265 target. The path exists on paper.
But as the money flow, the hidden bearish divergence, and today’s 7% rejection all confirm, this is a market that’s not buying it yet.
0
0


 Manage all your crypto, NFT and DeFi from one place
Securely connect the portfolio you’re using to start.


