Dogwifhat (WIF) Price Set for Decline After Bullish Pattern Break
4h ago•

bullish:
0
bearish:
0
Share
Solana-based meme coin Dogwifhat (WIF) has reversed its recent uptrend after breaking below an ascending channel. It trended within this channel between July 14 and 15.
At press time, WIF trades at $2.55, heading towards a new low.
Dogwifhat Breaks Below Support, But There Is a Silver Lining
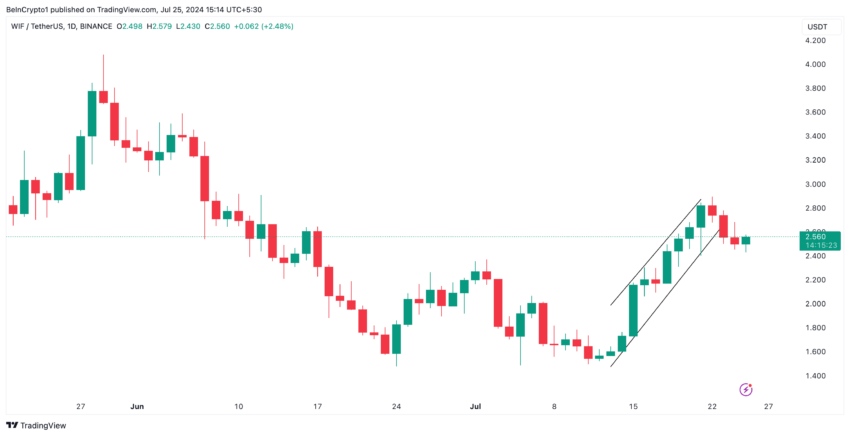
An assessment of WIF’s price movements on a daily chart revealed that it traded within an ascending channel between July 14 and 23. During that period, the meme coin’s price rose by 83%.
An ascending channel is a bullish signal formed when an asset’s price moves between two upward-sloping parallel lines. The upper line of the channel acts as resistance, while the lower line serves as support.
On July 23, WIF closed below the support level at $2.55 and has since trended downward.
 WIF Price Analysis. Source: TradingView
Generally, when an asset falls below the lower line of an ascending channel, it means that the bulls have failed to defend support. It signals that the asset’s uptrend has weakened, and selling pressure is gaining momentum. This is often a precursor to a price decline.
However, readings from other key technical indicators suggest that WIF’s current downtrend might be temporary as the bullish bias toward the meme coin is still significant.
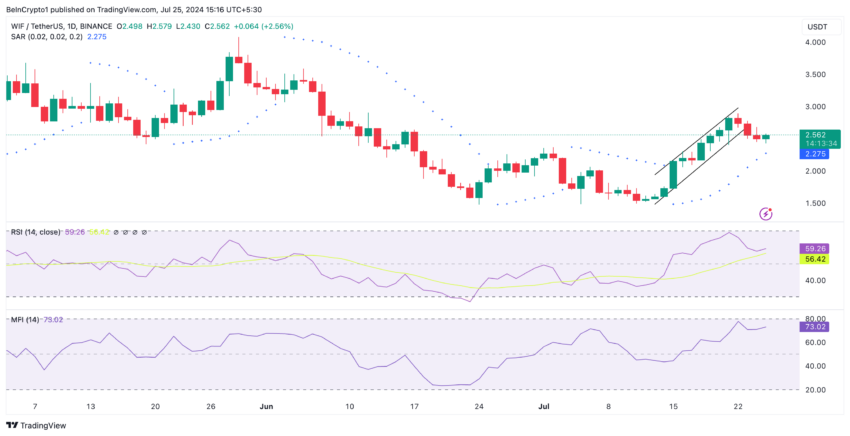
For example, the dots of WIF’s Parabolic Stop and Reverse (SAR) indicator still lie below its price.
This indicator is used to determine an asset’s potential price reversal points. When its dots rest under the price, the market is deemed to be in an uptrend. This positioning also confirms that the current uptrend is intact and may continue.
Further, WIF’s key momentum indicators show that market participants continue to accumulate the meme coin.
As of this writing, its Relative Strength Index (RSI) is in an uptrend at 59.33, while its Money Flow Index (MFI) is at 73.06. The values of these indicators suggest that WIF accumulation significantly outpaces selling activity.
Read More: How To Buy Dogwifhat (WIF) and Everything Else To Know
 WIF Price Analysis. Source: TradingView
These indicators measure an asset’s overbought and oversold market conditions. At their current values, WIF’s buying pressure remains high despite the price falling below the support level.
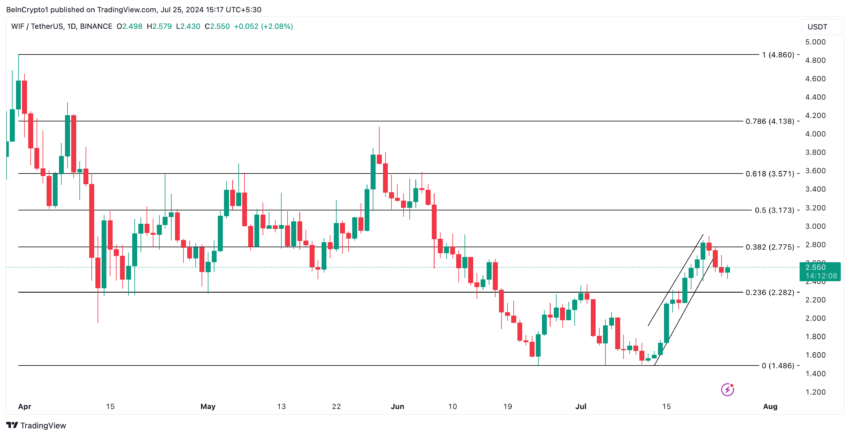
WIF Price Prediction: Rally to $2.77 or Decline to $1.48 Possible
If the demand for WIF continues to spike, it may push its price above support and back into the ascending channel, causing the meme coin to exchange hands at $2.77.
 WIF Price Analysis. Source: TradingView
However, if the downtrend continues, the altcoin may drop to $1.48.
4h ago•
bullish:
0
bearish:
0
Share


 Manage all your crypto, NFT and DeFi from one place
Securely connect the portfolio you’re using to start.

bullish:
0
bearish:
0

bullish:
0
bearish:
0

bullish:
0
bearish:
0

bullish:
0
bearish:
0