
Hyperliquid Price Prediction: $HYPE Institutions Chase $113 Target

0
0

Hyperliquid price prediction searches are picking up fast, and this time it is not just retail traders paying attention.
HYPE has quietly pulled off the same setup twice now, the kind of repeat pattern that tends to get noticed by the bigger players in the room, and it turns out the bigger players really have noticed.
Between what the chart is doing and what is now showing up in institutional flow data, this feels like one of those moments where HYPE latest news and HYPE price action are lining up in a way that is hard to ignore. Here is the full picture.
Hyperliquid Price Today: Live Data and 24-Hour Change
HYPE is trading at $86.604 as of this writing, down a mild 0.26% on the day after slipping about $0.2258, a small pullback that looks more like a pause than any real change in trend.
Futures volume over the last 24 hours stands at $3.09 billion against spot volume of $213.88 million, a gap that shows most of the current activity is still coming from derivatives traders positioning around these levels rather than fresh spot buying.
Hyperliquid's market cap sits at $21.83 billion, with open interest at $3.50 billion, a sizable amount of leverage that could add momentum to whichever direction the next move takes.
Circulating supply is at 251.94 million HYPE, and notably, both total supply and max supply sit at exactly 951.91 million, meaning the entire eventual supply schedule is already fixed and known, with roughly a quarter of it in circulation today.
Source: CoinGlass, HYPE market data, accessed September 7, 2026.
Institutions Are Reportedly Piling Into HYPE Through Spot ETFs
This is the part of the Hyperliquid news cycle that is genuinely turning heads.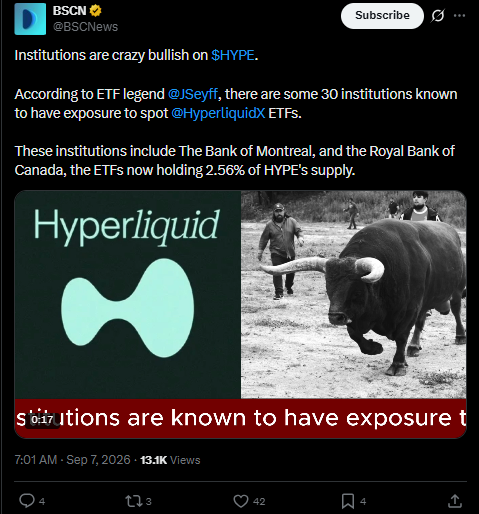
According to a post from BSCN on X, institutions are described as crazy bullish on HYPE right now, with ETF commentator known as JSeyff pointing out that roughly 30 institutions are known to have exposure to spot HyperliquidX ETFs.
The post names two fairly recognizable names in that group, the Bank of Montreal and the Royal Bank of Canada, and states that these ETFs now collectively hold 2.56% of HYPE's total supply.
That is not a small number for a token that only recently became a serious talking point among traditional finance players.
Institutional exposure through regulated ETF wrappers tends to bring a different kind of buyer into the picture, one that is generally less reactive to short-term price swings and more focused on long-term positioning.
If this trend continues to build, it could end up being one of the more meaningful HYPE trend analysis stories of the year, regardless of what the next few candles on the chart end up doing.
Source: Post by BSCN (@BSCNews) on X, September 7, 2026.
Quick Take: HYPE Price Action At A Glance
CMP: $86.602 (4-hour chart, Binance)
Price is on a 2nd retest of an ascending trendline, having already produced a solid bounce on the earlier test
4-hour trigger: sustained close above 86.823 with a break of the old high opens the path toward the $100 psychological level, then 113.080
Failure level: close below 78.311 risks a slide toward 74.885
Momentum oscillator carries repeated bearish tags and is currently reading 55.11, just above neutral
Data timestamp: September 7, 2026, 4h Binance perpetual chart
Risk note: open interest is high relative to spot volume, so a decisive move in either direction could get amplified by leveraged positioning
HYPE Technical Analysis September 2026: HYPE Technical Forecast
Looking at the 4-hour HYPE to TetherUS perpetual chart on Binance, the price is once again testing the same ascending trendline that has supported it since late August.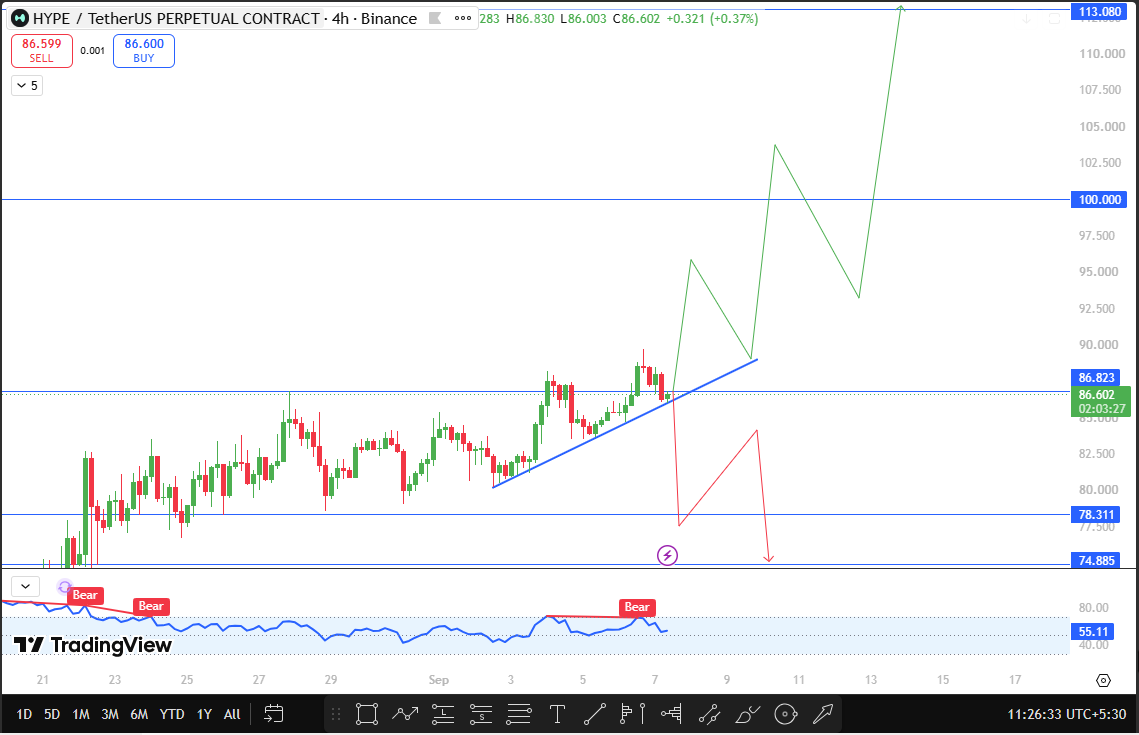
This is the second time HYPE has come back down to touch this line, and both times it has done so after carving out a fresh short-term high, which is generally read as a sign that the broader uptrend structure is still intact even during a pullback.
The momentum oscillator RSI has flashed a bearish tag more than once recently and currently sits at 55.11, just barely on the bullish side of neutral.
That kind of reading during a trendline retest is not unusual, since momentum naturally cools off during a pause even when the bigger trend has not actually changed.
The key trigger here is $86.823. If HYPE manages a 4-hour close above that level and follows through by breaking its prior high, the chart opens up toward the $100 mark, a level that carries obvious psychological weight simply because it is a clean round number that traders tend to watch closely.
Beyond that, the 1.618 Fibonacci extension sits at $113.080, which lines up with the kind of extended move the current chart structure is pointing toward if momentum picks back up the way it has on the last two legs higher.
None of this argues for a straight-line move either, since a pullback or two along the way would be entirely normal given how the prior legs of this trendline have played out.
On the downside, if this second retest fails outright and HYPE closes below $78.311, that would break the trendline structure that has held for weeks now.
In that scenario, the next support to watch is $74.885, a level the chart has flagged clearly as the next real floor if sellers take control.
Source: TradingView, HYPE/USDT Perpetual, Binance, 4h chart, accessed September 7, 2026, 11:26 UTC+5:30.
Hyperliquid Support and Resistance Levels to Watch
Level Type | Price | Distance From CMP |
Major Resistance | $113.080 | +30.6% |
Resistance 2 | $100.000 | +15.5% |
Resistance 1 | $86.823 | +0.3% |
Current Price | $86.602 | — |
Support 1 | $78.311 | -9.6% |
Major Support | $74.885 | -13.5% |
Bull Case, Base Case, And Bear Case For HYPE
The bullish scenario here is fairly clean. HYPE just needs to hold this trendline one more time, push through $86.823, and take out its recent high to put the $100 level firmly in play.
With institutional money reportedly building a position through spot ETFs in the background, there is a case to be made that dips like this one are exactly what those larger buyers are waiting for, which could add extra support underneath the trendline itself.
The base case is that HYPE spends a bit more time chopping around this trendline zone, testing it a third time before committing fully in either direction.
Given the mixed momentum readings lately, some additional consolidation here before a real breakout would not be out of the ordinary at all.
The bearish case shows up if this second retest simply does not hold. A close below $78.311 would break the trendline structure that has been intact for weeks, and that kind of breakdown would likely trigger a deeper flush toward $74.885, especially with the amount of leverage currently sitting in the market.
Risks To This Hyperliquid Price Prediction
The institutional ETF flow story is encouraging, but it is still early, and 2.56% of supply, while notable, is not yet large enough to be treated as a guaranteed floor under the price.
Elevated open interest relative to spot volume also means any sharp move could see outsized liquidations pushing price further and faster than the underlying trend alone would suggest.
Wider crypto market conditions matter here too, since a risk-off shift across Bitcoin or the broader altcoin market could easily interrupt this trendline setup regardless of how constructive it looks in isolation right now.
Key Terms Explained
Ascending Trendline: A rising support line connecting a series of higher lows, used by traders to gauge whether an uptrend is still structurally intact.
Fibonacci Extension: A technical tool used to project potential price targets beyond a prior move, based on ratios like 1.618, commonly applied once a breakout is underway.
Open Interest: The total value of outstanding derivative contracts that have not yet been settled, often used to measure how much leveraged money is active in a market.
Disclaimer
This article is for informational purposes only and should not be taken as financial advice. Cryptocurrency markets are highly volatile, and price predictions are based on technical analysis that can change quickly with new market developments. Always conduct your own research before making any investment decisions.
0
0

 从同一位置管理所有加密资产、NFT 和 DeFi 资产
安全地关联您正在使用的投资组合,以开始交易。


