Why Is The Crypto Market Down Today?

0
0
The crypto market is marginally down today, slipping 0.18% to $2.50 trillion. The decline eroded roughly $4.6 billion in value.
Bitcoin (BTC) dipped 0.19% to $74,696 as a critical resistance continues to reject it. Meanwhile, RaveDAO (RAVE) corrected 47% from its all-time high after an 8,787% rally. It is now forming a bull flag near $10.88.
In the news today:-
- Solana posted a mysterious one-word “XRP” message on X that went viral, sparking cross-community engagement, though no partnership was confirmed.
- BNB Foundation completed its 35th quarterly burn, destroying 1.57 million BNB worth roughly $1.02 billion and reducing total supply to 134.79 million.
- Bitwise launched the Avalanche ETF (BAVA) on the NYSE with a 5.4% staking yield, expanding institutional access to the AVAX ecosystem.
Crypto Market Holds Above $2.49 Trillion Despite Minor Profit-Taking
The total crypto market cap slipped marginally but continues to hold above $2.50 trillion. The decline does not signal a structural breakdown. It aligns with minor profit-taking after the S&P 500 hit a new all-time high on April 15. Some capital may be rotating into equities as stocks reclaim record territory.
Despite the dip, the last two daily candles have held above the 0.618 Fibonacci level at $2.49 trillion. That zone had acted as resistance for weeks and is now being tested as support. Holding it is key.
Want more token insights like this? Sign up for Editor Harsh Notariya’s Daily Crypto Newsletter here.
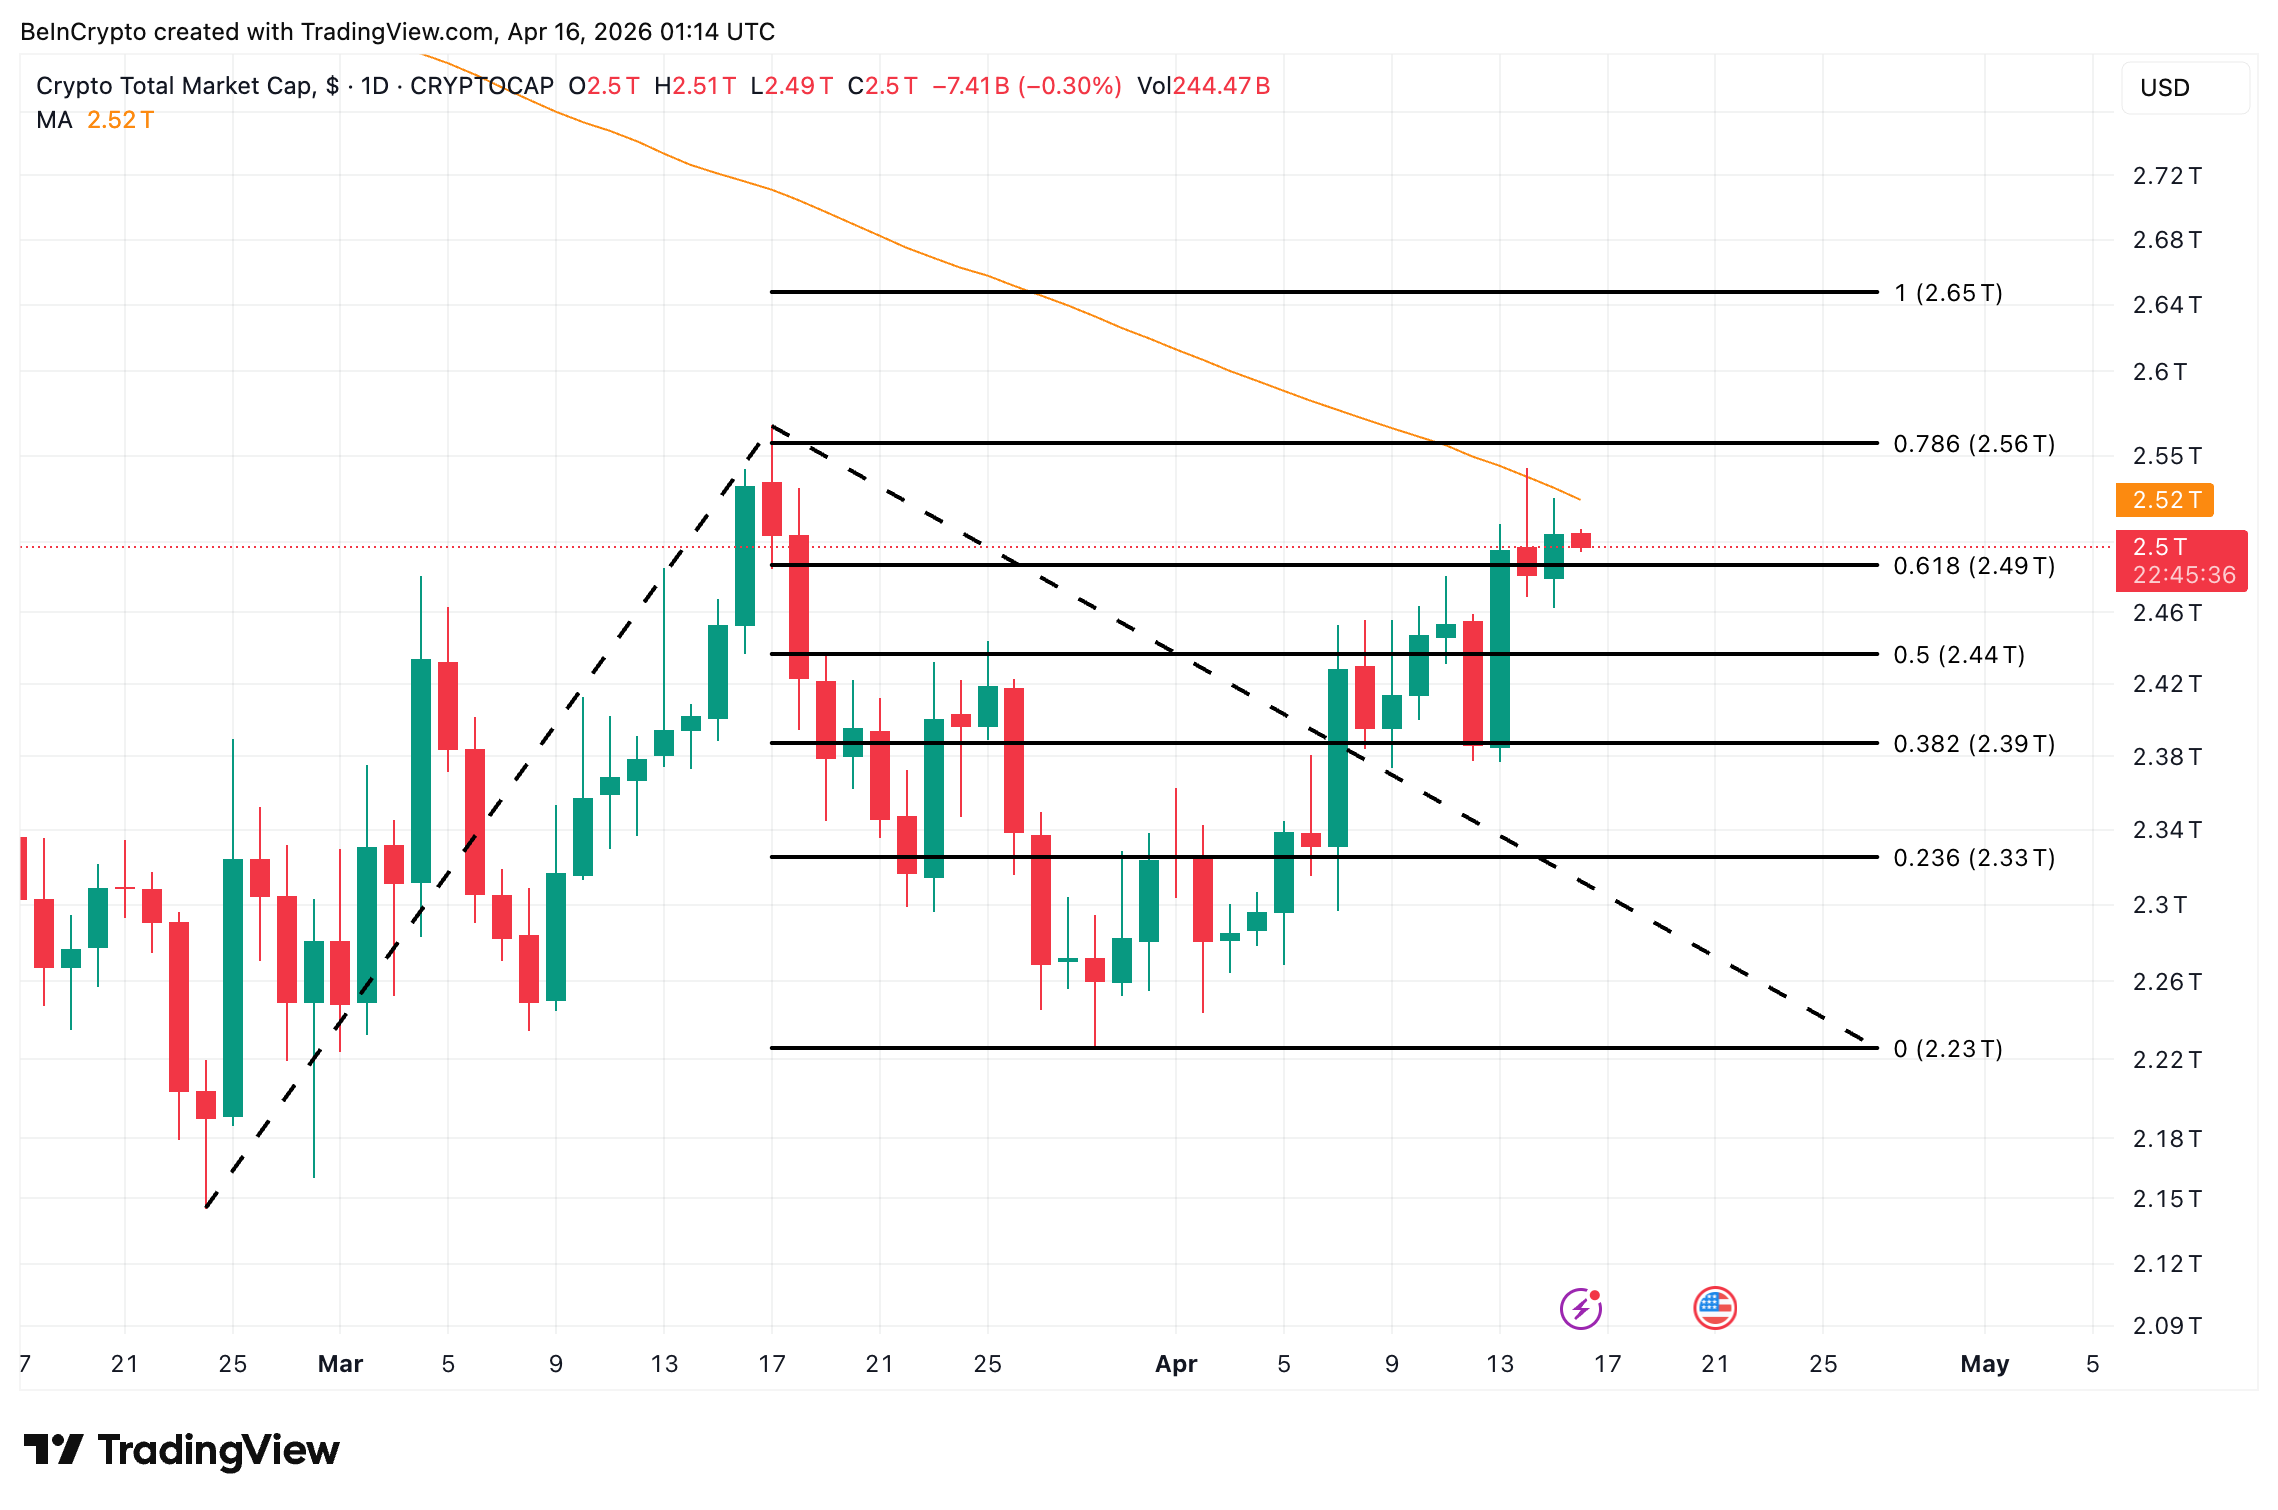 TOTAL Crypto Market Cap Analysis: TradingView
The 100-day Simple Moving Average (SMA) sits at $2.52 trillion. An SMA smooths closing prices over a set period to show the trend. A daily close above $2.52 trillion would confirm continuation. If $2.52 trillion is reclaimed, $2.56 trillion and $2.65 trillion become the next targets.
However, if profit-taking deepens and the market loses $2.49 trillion, support drops to $2.44 trillion and $2.39 trillion.
Bitcoin Rejected for Three Sessions as a Bearish RSI Signal Builds
Bitcoin price sits at $74,696, down 0.19%. While the total market cap holds above its 0.618 Fibonacci, BTC is struggling at the same level.
The 0.618 Fibonacci level at $74,813 has rejected Bitcoin over the past three sessions. Each attempt to reclaim it has failed. BTC remains range-bound just below that critical threshold.
The Relative Strength Index (RSI) measures the speed and size of recent price moves. It adds a warning here. Between February 2 and April 15, BTC’s price made a lower high. The RSI made a higher high at 62.07. That pattern forms a hidden bearish divergence, which typically signals continuation of the existing downtrend.
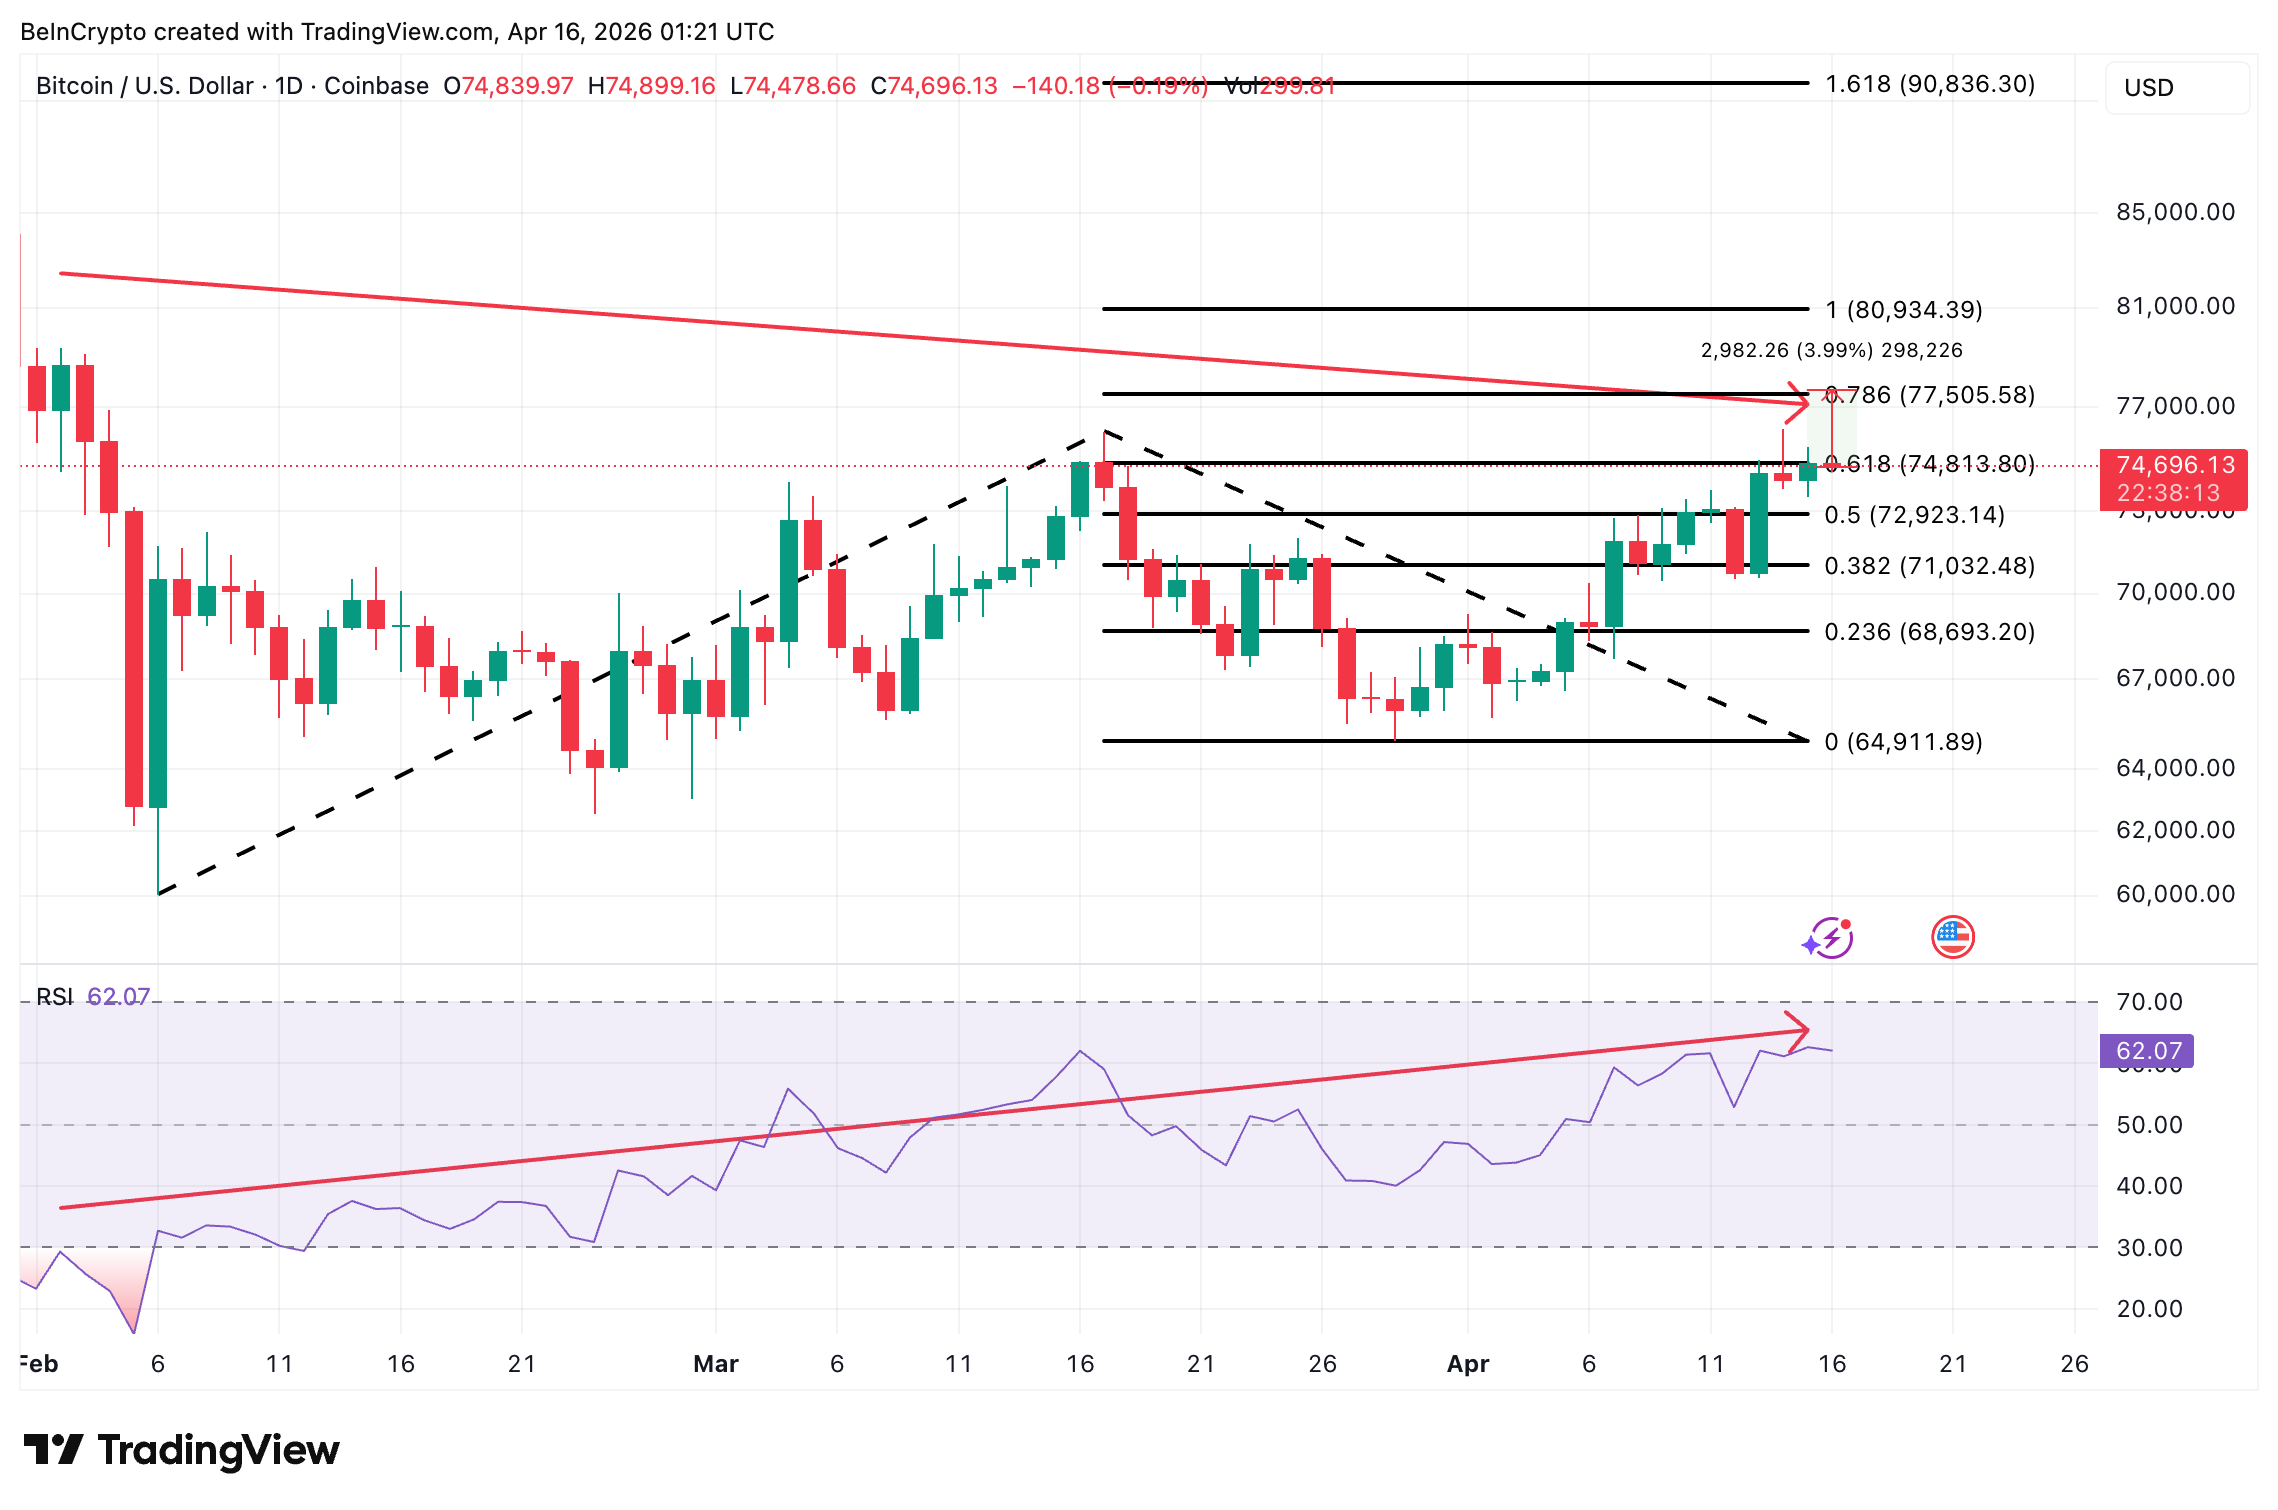 Bitcoin Price Analysis: TradingView
Whether the downtrend fully resumes or this is just a shallow pullback depends on $72,923. That is the 0.5 Fibonacci level. Holding above it keeps the pullback scenario alive. A loss of it would shift momentum toward $71,032 and $68,693.
Yet a daily close above $74,813 would weaken the bearish signal. That opens targets at $77,505 and $80,934.
RaveDAO Corrects 47% After the Rally, but a Bull Flag Forms
RaveDAO (RAVE) corrected 47% from its April 15 high of $19.97, currently trading near $10.88. The correction follows an extraordinary rally of 8,787% that started on April 2.
Despite the sharp pullback, the consolidation forming on the daily chart resembles a bull flag pattern. A breakout above $12.43, the upper trendline of the flag, would expose $19.97 as the next resistance. That level marks the all-time high and a psychological barrier. A move above it would reignite the rally with fresh targets based on the pole’s projection.
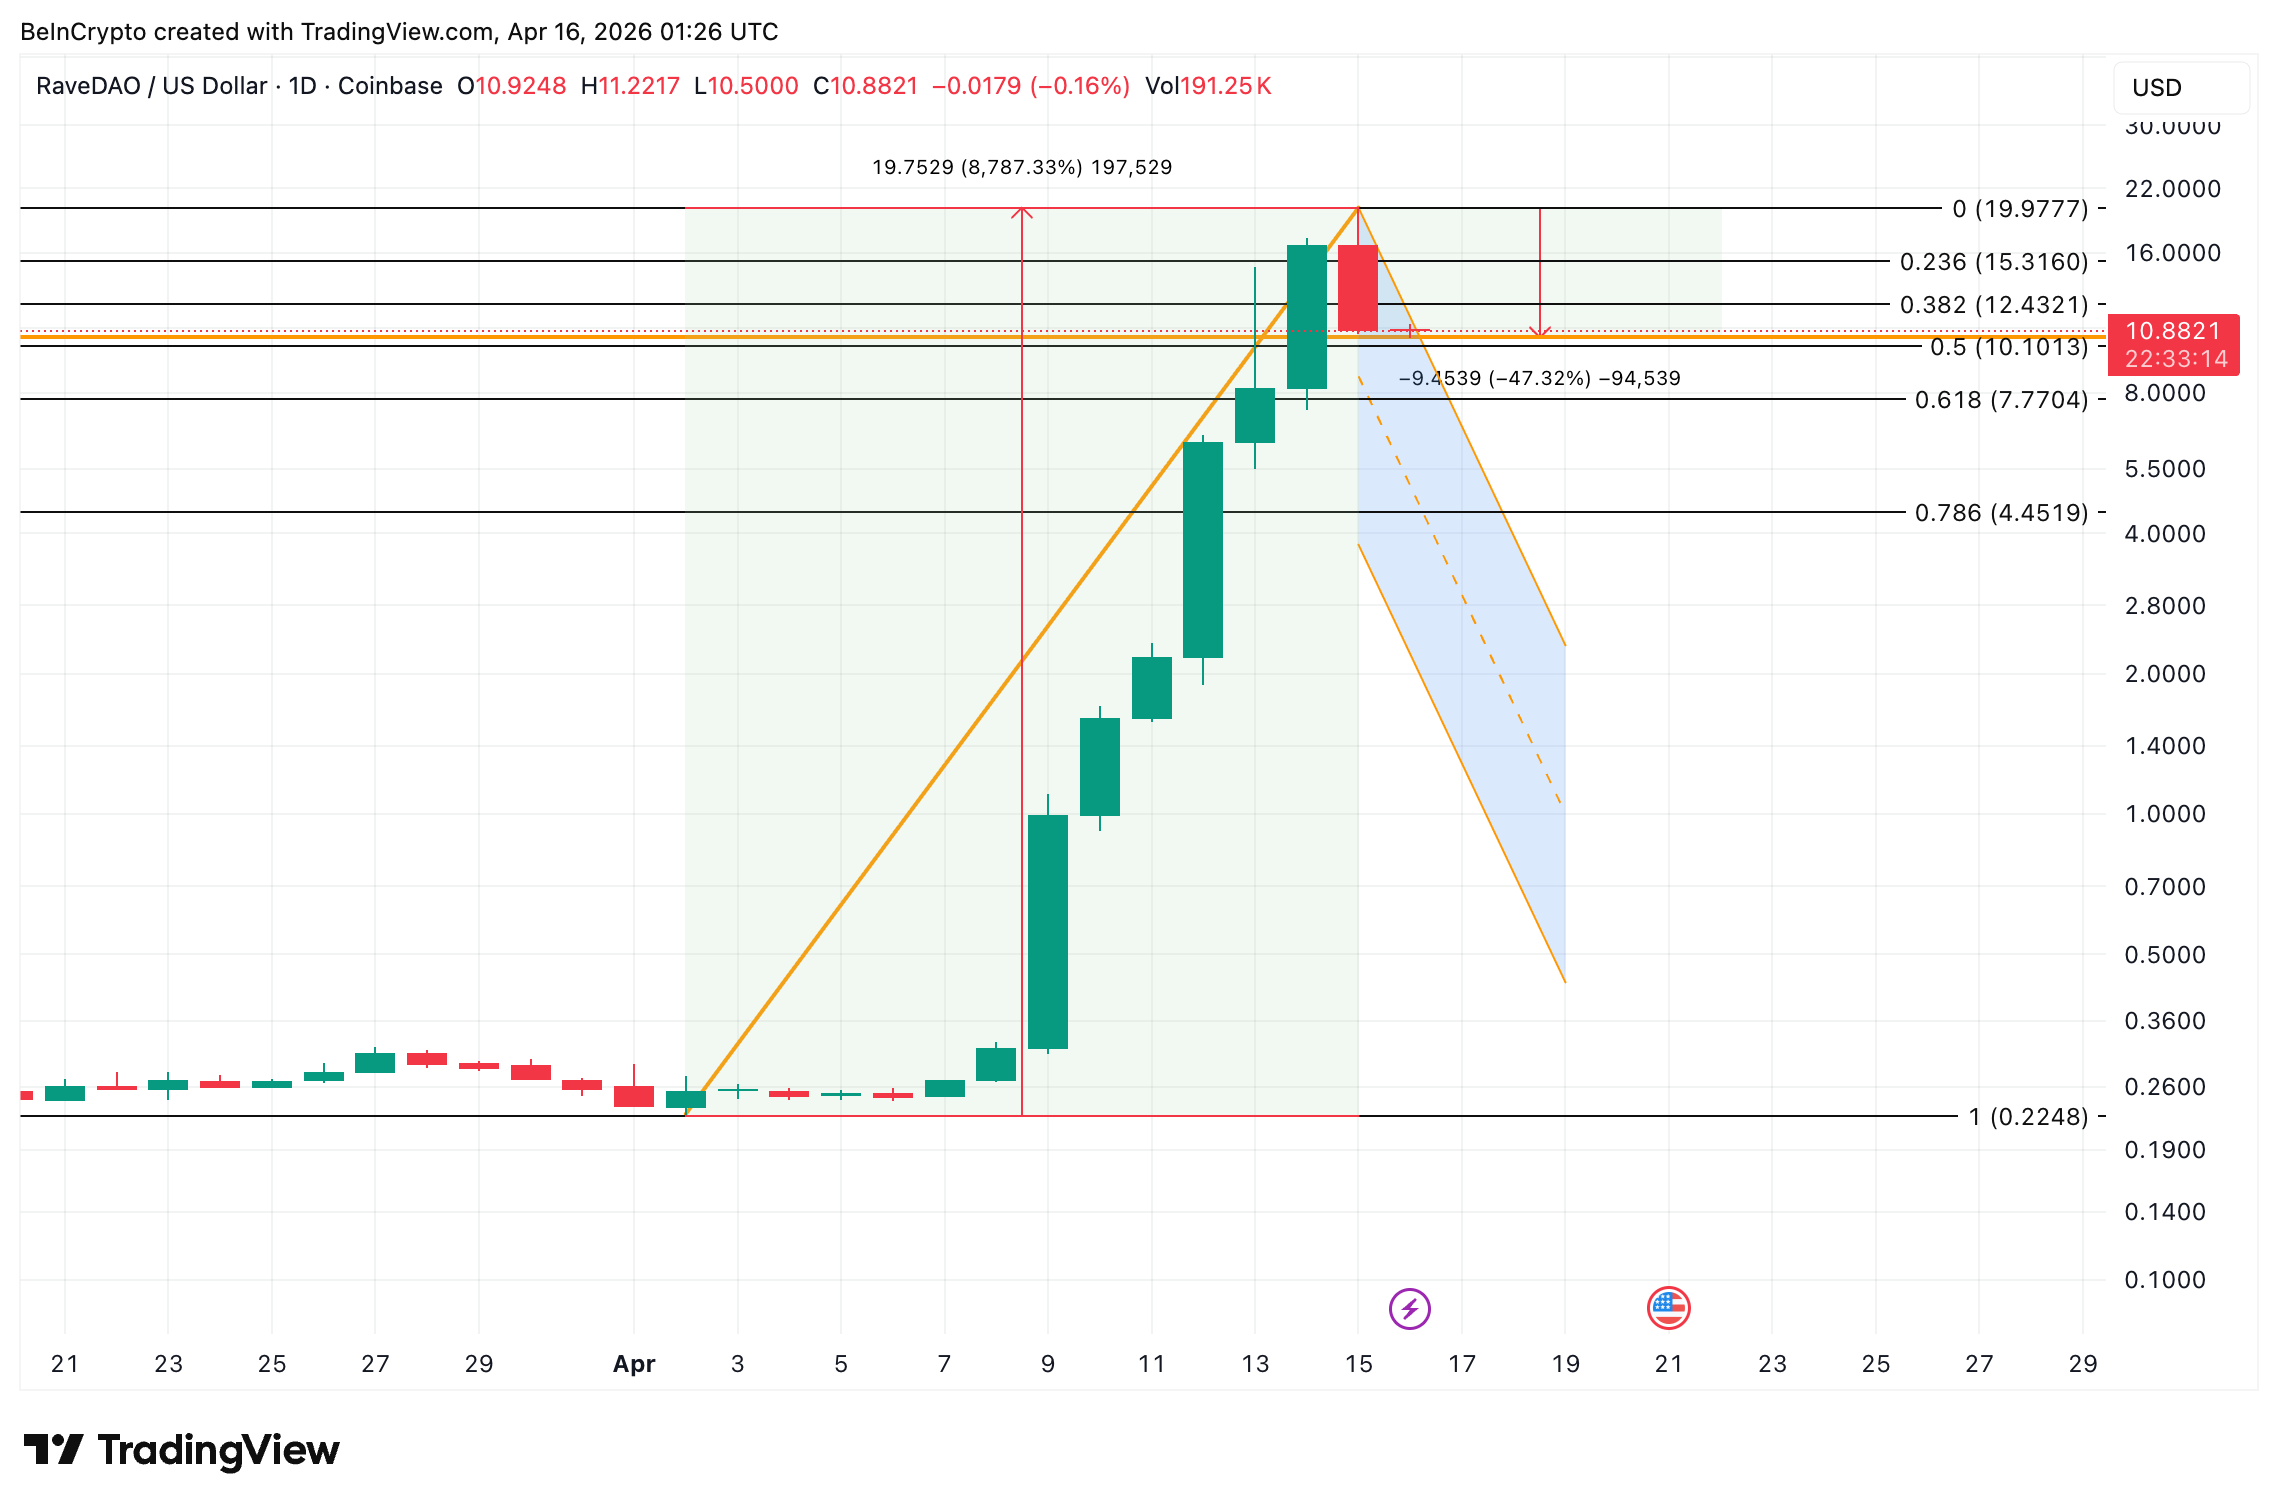 RaveDAO Price Analysis: TradingView
However, the pattern weakens if RAVE drops below $7.77, the 0.618 Fibonacci level. A drop to $4.45 could technically keep the flag alive given the pole’s extreme length. Yet it would significantly reduce conviction. Immediate support sits at $10.10, the 0.5 Fibonacci level.
$12.43 separates a return to all-time highs from a deeper correction into the flag’s lower range.
0
0


 Manage all your crypto, NFT and DeFi from one place
Securely connect the portfolio you’re using to start.


0
0


0
0