Ethereum Price Prediction: ETH Price Might NOT Hold the Line And CRASH?

0
0

Ethereum ($ETH) is at a decisive point on the charts. After weeks of volatility, the price is consolidating around $4,300, balancing between strong technical support and stiff resistance. With the crypto market searching for direction, Ethereum’s performance could set the tone for the next major altcoin move.
Key Support and Resistance Levels
- Immediate support: $4,127 (50-day SMA)
- Resistance zone: $4,356 – $4,500
- Secondary supports: $3,838 and $3,530
- Major support: $2,728 (200-day SMA)
- Upside target: $5,000 psychological barrier
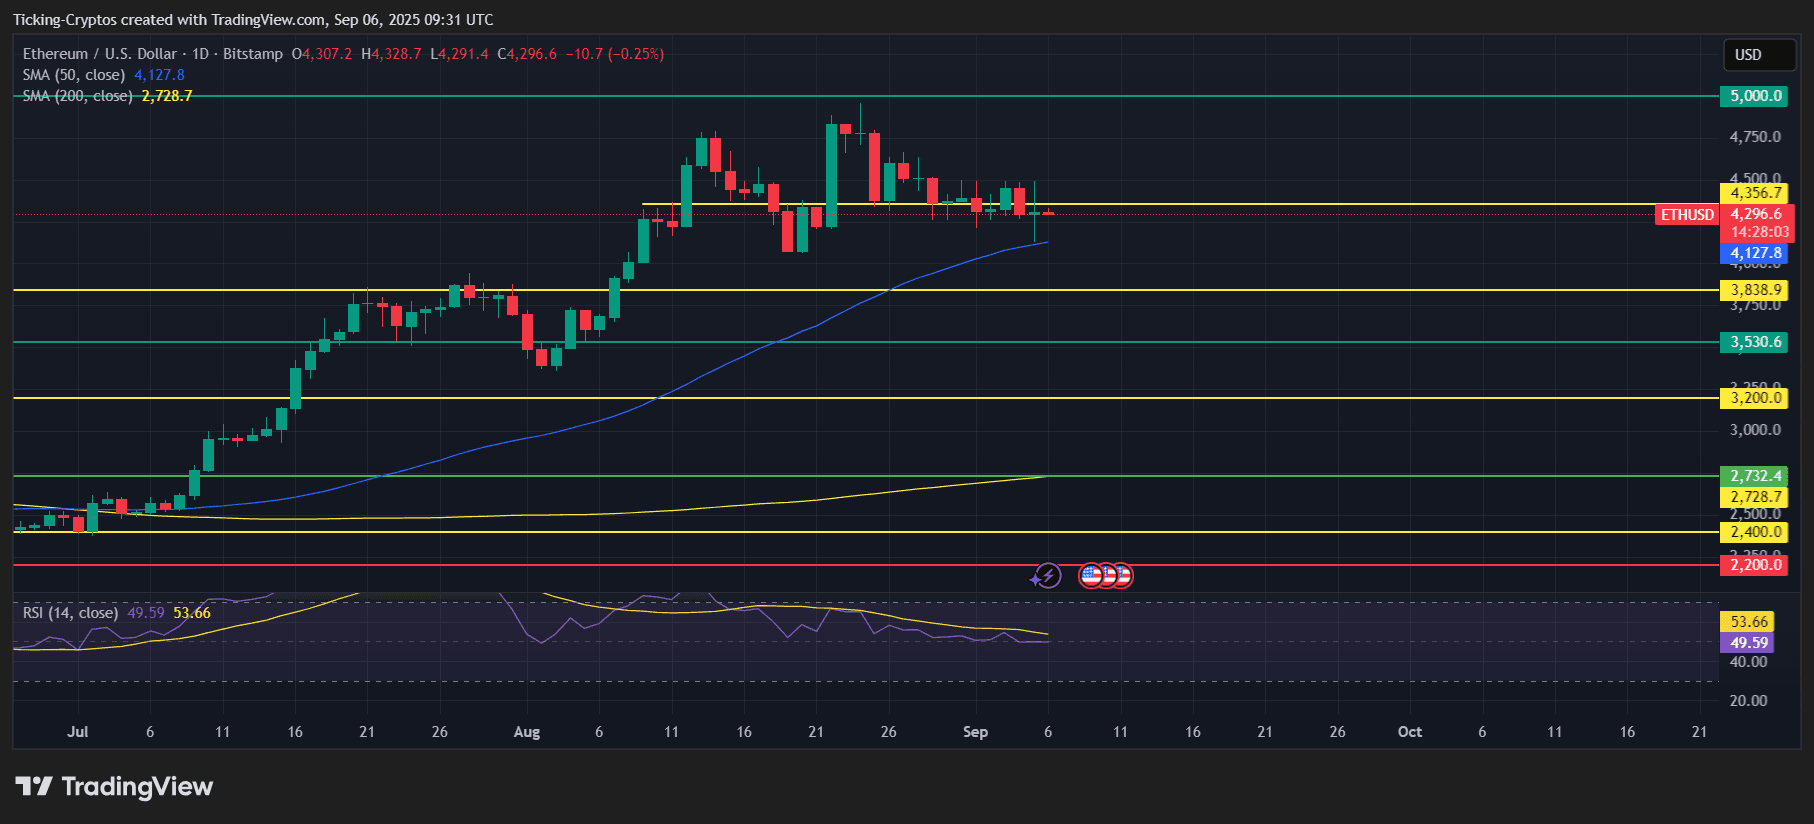
ETH/USD 1-day chart - TradingView
The chart shows ETH repeatedly testing the $4,127 level, where the 50-day moving average has been acting as a cushion. A decisive bounce here could fuel a push back toward $4,356 and beyond, while a breakdown may open the door to $3,838 or even $3,530.
Momentum and RSI Signals
Ethereum’s RSI is hovering near 49–53, sitting right on neutral ground. This suggests the market is undecided, with neither bulls nor bears holding dominance. A break above RSI 55 could trigger bullish momentum, while a slip below 45 may confirm further downside pressure.
A Portfolio Manager’s Take on Ethereum Price
From a professional trading and portfolio management perspective:
- Bullish Scenario: If ETH holds above $4,127 and breaks past $4,356 resistance, the path to $4,750 and ultimately $5,000 becomes more likely. Portfolio managers could justify increasing exposure if institutional inflows mirror Bitcoin’s strength.
- Bearish Scenario: A close below $4,127 risks accelerating selling pressure, dragging ETH back toward $3,800 or $3,530. Portfolio managers may consider trimming positions or hedging exposure if this support fails.
Risk management remains critical, as ETH is consolidating near its short-term trendline support.
Ethereum Price Prediction: What's Next for ETH Price?
In the short term, $Ethereum is likely to trade within a $4,127 – $4,356 range until a catalyst sparks momentum. Breaking out above $4,356 would set up a retest of $4,750 and eventually $5,000. On the downside, losing the 50-day SMA could trigger a sharper correction toward $3,800 and $3,530 before stabilizing.
For long-term investors, the $2,728 200-day SMA remains the line in the sand. As long as ETH holds above it, the macro uptrend remains intact.
0
0


 Manage all your crypto, NFT and DeFi from one place
Securely connect the portfolio you’re using to start.


0
0

0
0
