Chainlink (LINK) Builds Steam — Is a Trend Reversal on the Horizon?

0
0


Chainlink (LINK) is attempting a steady increase from $12.00. The price is showing positive signs and might aim for an upside break above $16.00.
Chainlink Price Recovers Over 15%
After a downside extension, Chainlink found support near the $12.00 zone. A low was formed at $11.89 and the price recently started a recovery wave. There was a move above the $12.50 and $13.20 resistance levels.
LINK outperformed Bitcoin and was able to clear the $14.50 resistance. It is now approaching the 23.6% Fib retracement level of the downward move from the $27.12 swing high to the $11.89 low.
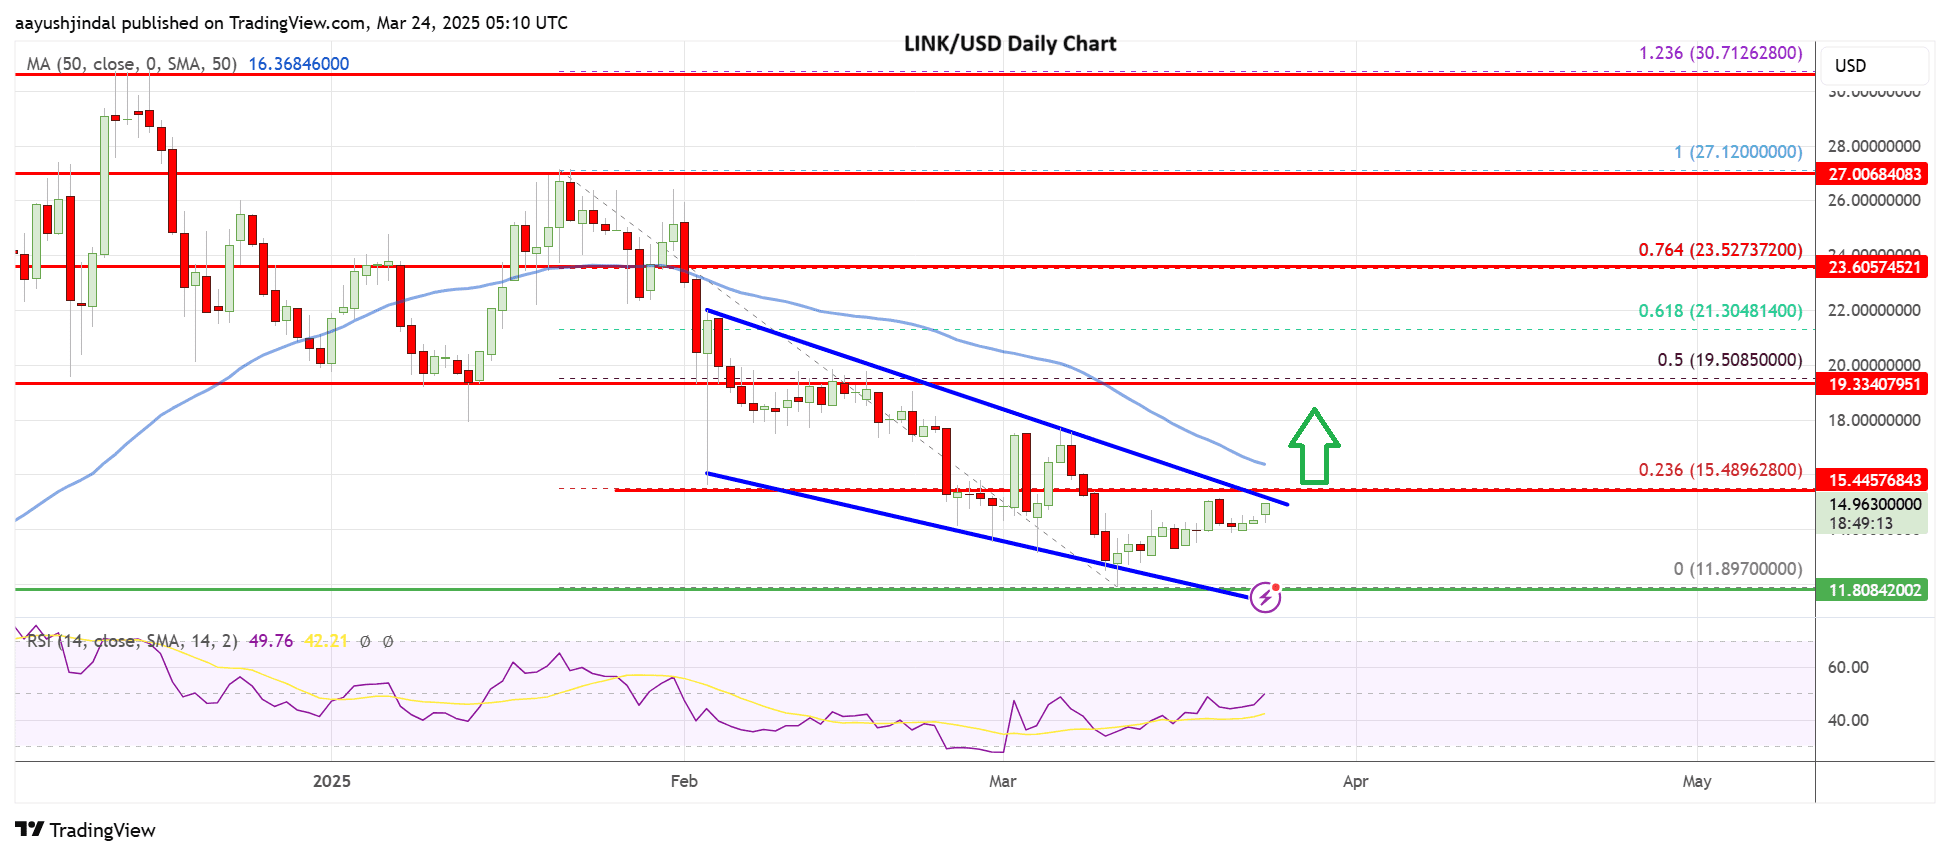
LINK price is now showing many bullish signs above the $15.00 level but it is still below the 50-day simple moving average (blue). In the last two days, there was a fresh increase and the price is now attempting a move above the $15.00 resistance.
There is also a key declining channel forming with resistance at $15.00 on the daily chart. A close above the channel resistance could start a steady increase.
The next resistance is $16.00 and the 50-day simple moving average (blue). If the bulls manage a daily close above the 50-day simple moving average (blue), the price could see a reversal. In the stated case, LINK could rise and drift toward the $19.50 level (a multi touch zone).
The 50% Fib retracement level of the downward move from the $27.12 swing high to the $11.89 low is also near the $19.50 level. The main resistance is now forming near the $20.00 level.
If the bulls clear the $20.00 hurdle, it could open the doors for a pump toward the $22.50 resistance zone. The next key resistance is near the $23.80 level. Any more gains might send LINK price toward the $27.00 level.
Another Decline In LINK?
If Chainlink fails near $15.00 or $16.00 and the 50-day simple moving average (blue), there could be a downside correction. Immediate support is near the $14.00 zone.
The next major support is at $13.20, below which LINK price might slide and test $12.00 (a multi-touch zone) and the channel’s trend line. Any more losses might call for a dip toward the $10.50 support zone in the coming days.
Overall, Chainlink’s LINK price is gaining pace above the $14.50 resistance zone. However, the bulls need to overcome $16.00 and the 50-day simple moving average (blue) to push the price further higher in the near term.
0
0

 Manage all your crypto, NFT and DeFi from one place
Securely connect the portfolio you’re using to start.

0
0


0
0

0
0