
Airbus stock eyes 113.20 break as bullish bias builds

0
0

Airbus stock (AIR) holds above key pivots as daily bias turns cautiously constructive. Price sits just over the central pivot while momentum repairs. The stance is neutral with a bullish tilt, and a break of 113.20 remains the immediate trigger for follow-through.
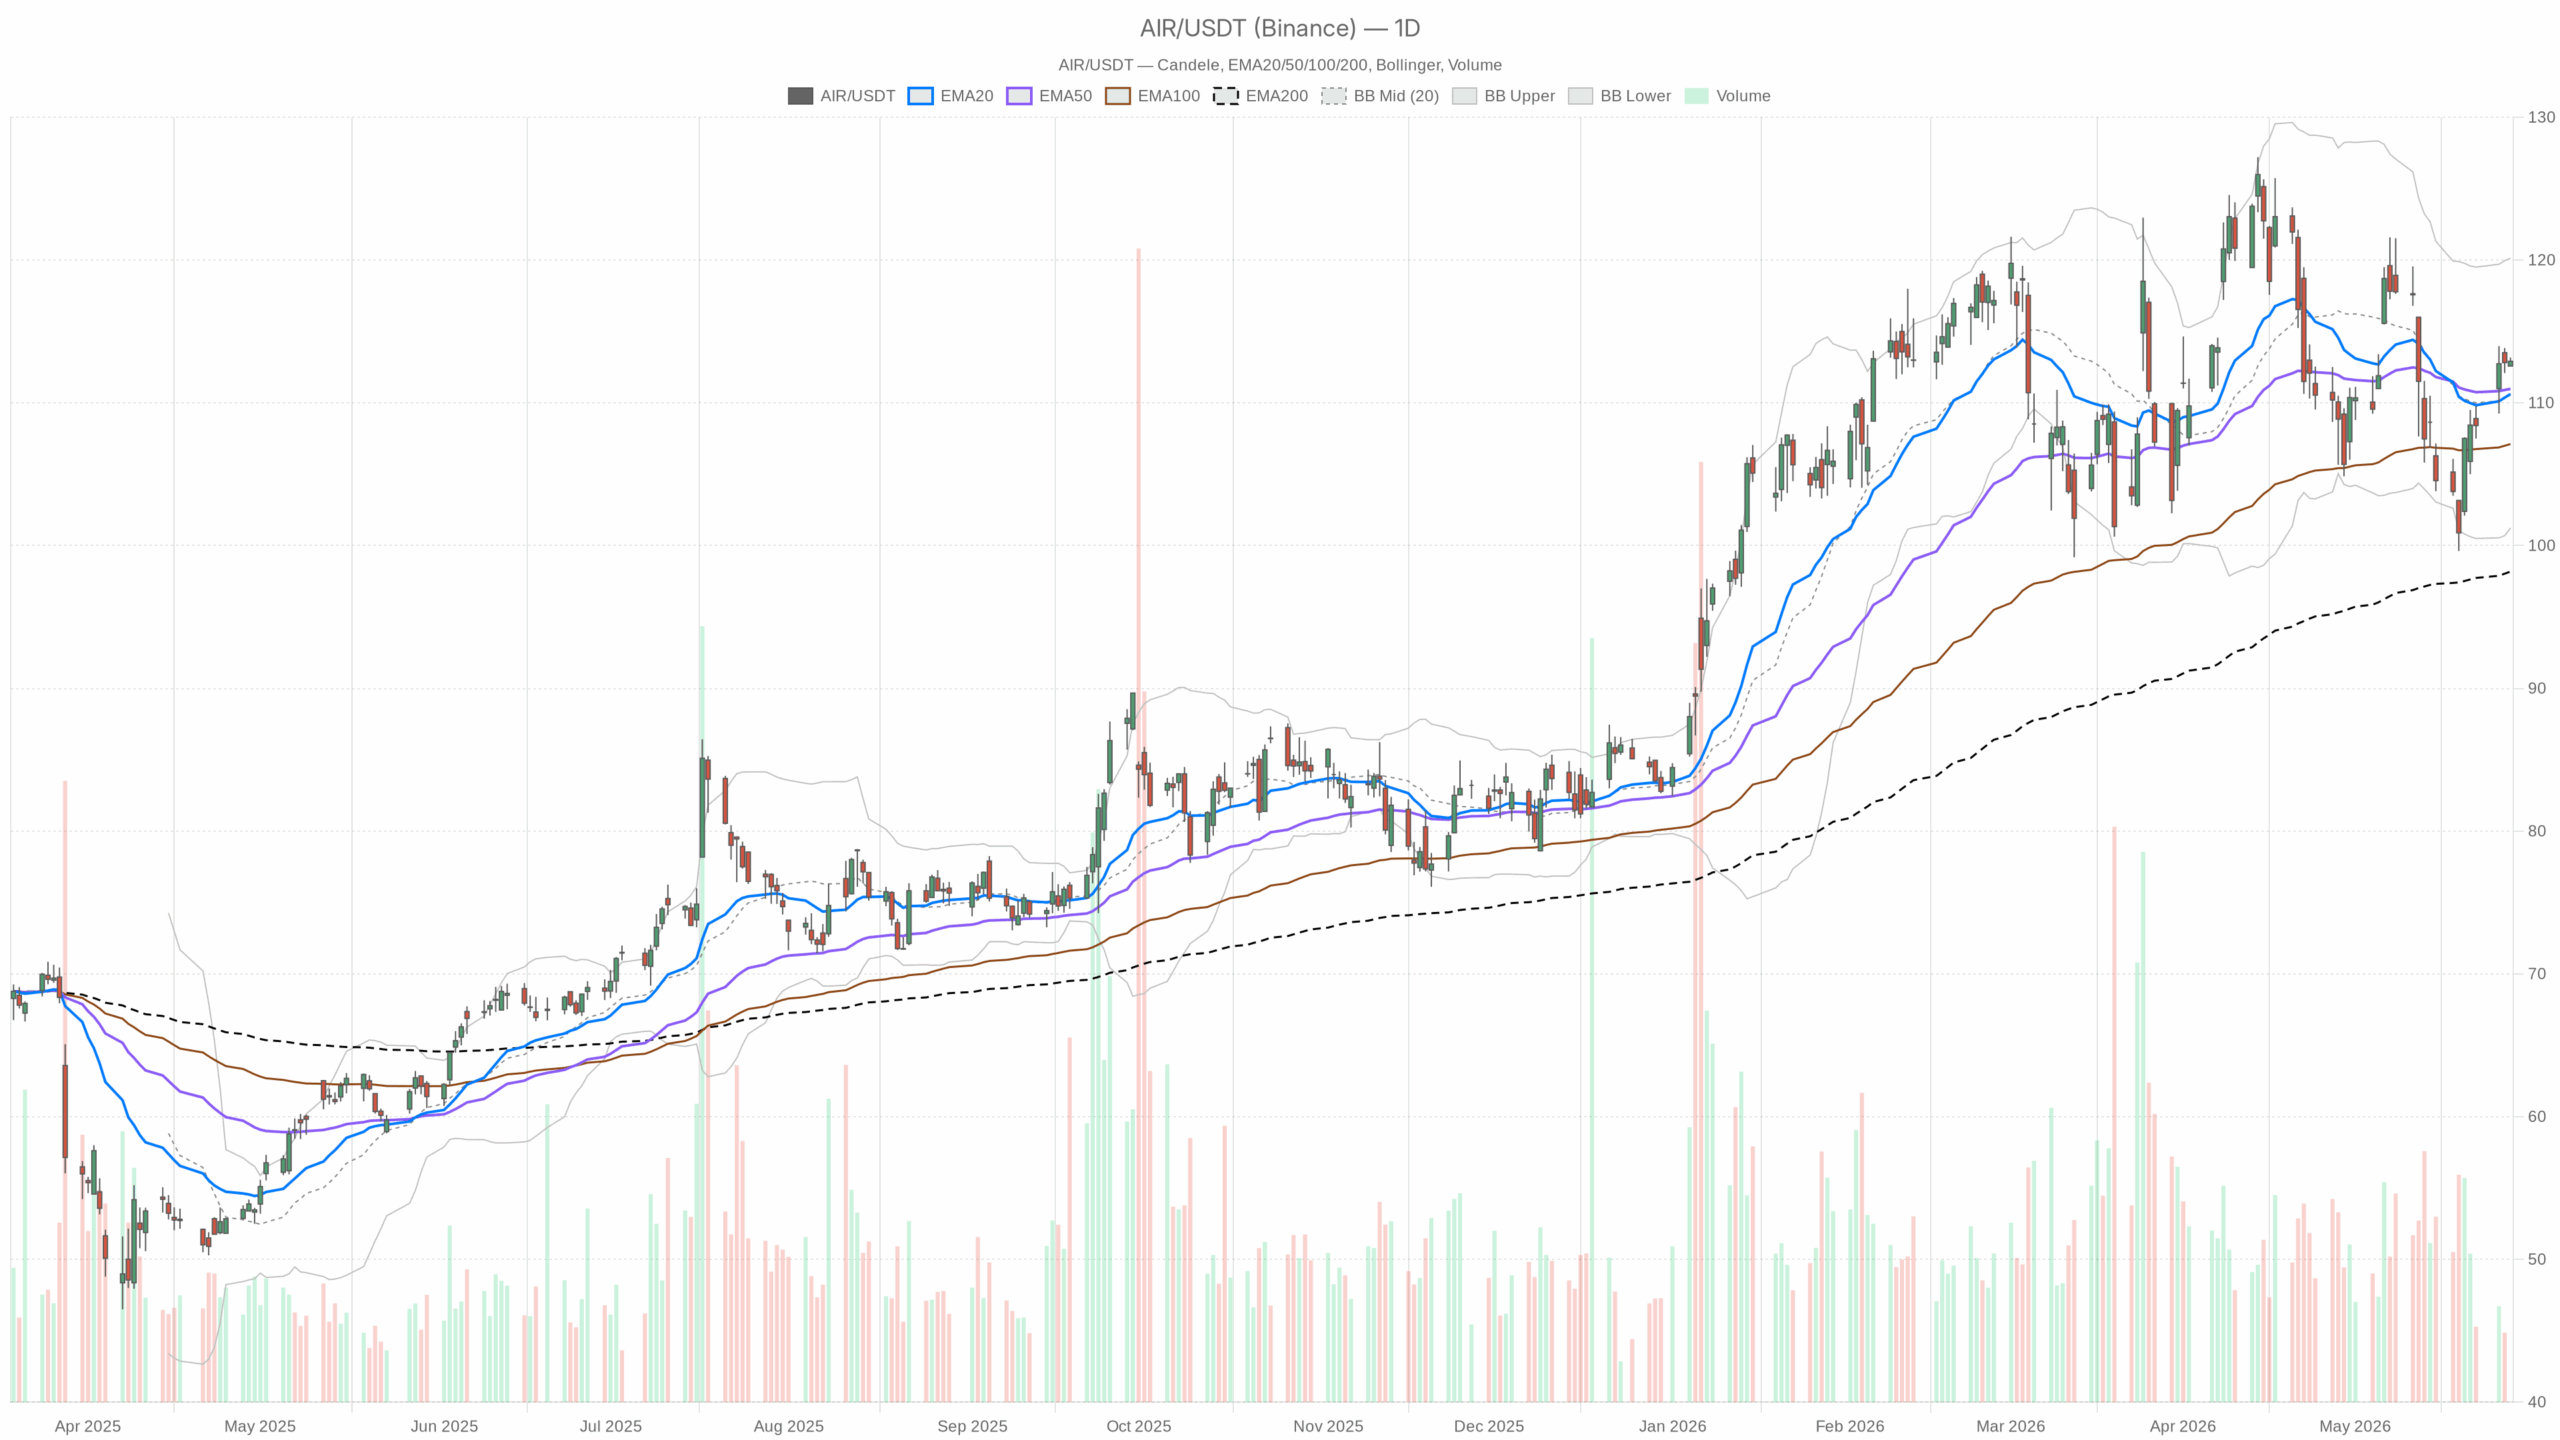
Airbus stock daily outlook: holding above pivots
Trend and momentum
On the daily timeframe, AIR closed at 112.91, above the 20-day EMA at 110.61 and the 50-day EMA at 110.98, and well over the 200-day at 98.18. Interpretation: price above all three EMAs keeps the broader uptrend intact. However, the 20-day still trails the 50-day, so alignment is incomplete.
The daily RSI(14) prints 53.16, keeping momentum neutral to firm rather than stretched. Meanwhile, MACD shows the line at -0.74 versus a -1.28 signal, with a +0.54 histogram. Interpretation: downside momentum is fading and turning up from below zero.
Daily Bollinger Bands center on 110.69, with the upper band at 120.14 and the lower at 101.24. Therefore, price sits above the mid-band with room before the upper envelope. The ATR(14) at 4.21 keeps daily ranges wide enough for multi-point swings.
Pivot map and ranges
The daily pivot is 112.89, with R1 113.20 and S1 112.60. Interpretation: price is hugging the pivot; a sustained push through 113.20 would brighten the tone, while a drop under 112.60 would dull it.
1H intraday structure and momentum
Meanwhile, Airbus stock trades at 112.91, above the 20-hour EMA at 111.53, the 50-hour at 109.72, and the 200-hour at 111.11. Interpretation: intraday structure is positive with the 20-hour leading.
The 1H RSI(14) is 64.6, showing buyers in control, though a touch extended. In contrast, MACD prints a 1.44 line versus a 1.55 signal, with a -0.11 histogram. Interpretation: the up-move is pausing as momentum cools slightly.
Hourly Bollinger Bands center at 111.64, and price trades in the upper half of the set. The 1H ATR(14) at 0.91 signals moderate intraday volatility. Hourly pivots mirror the daily: pivot 112.89, R1 113.20, S1 112.60. Interpretation: the market is coiling just beneath resistance and above first support.
15-minute execution context: compression near micro levels
At the same time, the 15-minute tape for Airbus stock offers clean execution context. Price sits around 112.91 with EMAs stacked bullishly (EMA20 112.85 > EMA50 112.19 > EMA200 109.68). Interpretation: short-term bias is up while above the 20-period average.
The 15m RSI(14) is 52.2, keeping momentum balanced after the early push. However, MACD shows a small negative histogram at -0.04, so micro momentum is flat to slightly cooling.
Bollinger Bands center on 112.89 with relatively tight bands (113.31/112.47). Therefore, compression argues for a directional move if 112.98 (15m R1) breaks or 112.88 (15m S1) fails. The 15m pivot is 112.95. Interpretation: holding above this micro pivot favors a test of 113.20, while losing it risks a slip toward 112.60.
Sector context: airlines firmer on softer oil
Notably, broader airline shares have firmed on softer oil, according to recent headlines. Interpretation: the sector tone is supportive, but Airbus is trading its own technical levels today.
Scenarios for Airbus stock
Bullish path above 113.20
Bullish scenario: a decisive break and hourly close above 113.20, followed by a daily hold over 112.89, would reinforce the constructive bias. Therefore, that unlocks room toward the upper half of the daily Bollinger channel. Momentum confirmation would come if the daily MACD rises toward zero and RSI grinds into the high-50s.
Bearish path below 112.60
On the other hand, the bearish path emerges if 112.60 fails and price closes the day back below 112.89. In that case, focus shifts to the 110.61–110.98 EMA cluster and the daily Bollinger mid at 110.69. A break of that zone would invalidate the near-term bullish tilt and expose a deeper pullback, with the 200-day EMA at 98.18 the larger trend reference.
Overall, positioning into 113.20 resistance looks balanced but fragile. The daily bias is neutral-bullish, the 1H trend is supportive, and the 15m tape is coiled. Still, ATR is elevated, so expect choppy probes around the pivot stack before direction resolves.
0
0
 Manage all your crypto, NFT and DeFi from one place
Securely connect the portfolio you’re using to start.