PI Coin Price Drops 26% – Will the Downtrend Continue or a Rebound Ahead?

1
1

The post PI Coin Price Drops 26% – Will the Downtrend Continue or a Rebound Ahead? appeared first on Coinpedia Fintech News
In the last seven days, the cryptocurrency market has seen a notable growth of 5.61%. During this period, the Bitcoin market has experienced a surge of 5.2%, and the altcoin market has witnessed a rise of 4.85%. In contrast to this general bullish trend in the crypto market, PI, one of the most sensational cryptocurrencies in 2025, has recorded a severe decline of 26.3% during the period. In the last 24 hours alone, the PI market has registered a significant drop of 9.4%. Will PI continue its downtrend, or can bulls regain momentum? Here is a look at what is driving its price movement.
PI’s Price Continues to Drop
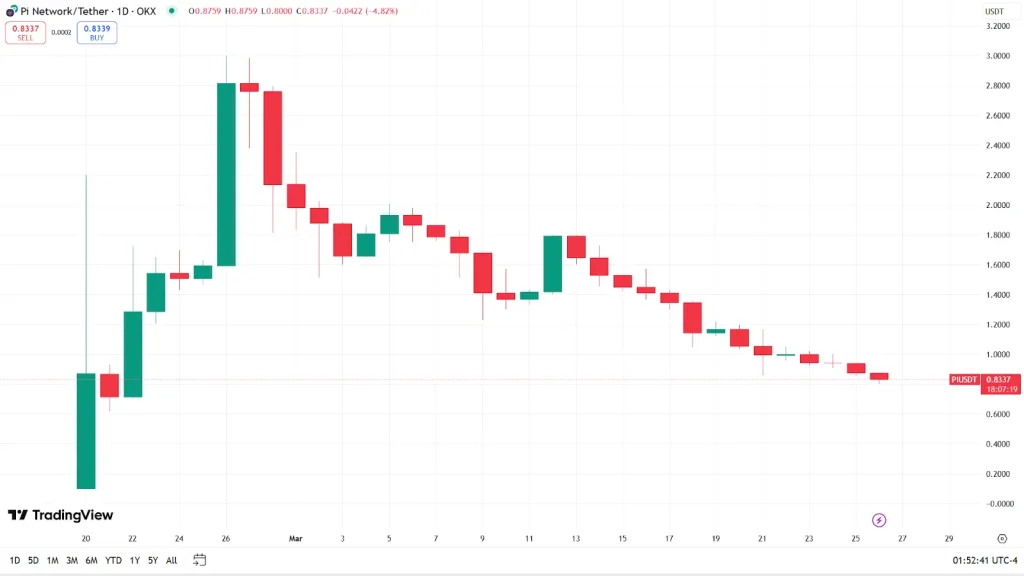
At the start of February 20, the PI price was at $0.1071. Between February 20 and February 26, the PI market experienced a massive growth of 2,688.79%. At one point of February 26, the PI price even surpassed the crucial $3 level. However, one February 27, sellers overpowered buyers in the PI market. It marked the beginning of a period of consistent decline in the market. Since then, the market has dropped by no fewer than 70.40%.
In the last seven days, the Pi price has declined by 26.3%. In the last 24 hours alone, PI has dropped by over 9.4%. This indicates that sellers maintain clear dominance in the market right now, and there is no sign of buyers attempting to regain their control.
Why PI Is Facing Selling Pressure
It appears that traders are moving away from the PI market. Data show that demand for PI has also dropped consistently especially since February 27.
Certain technical and chart analysis reports also support the aforementioned observation.
PI Technical Analysis: OBV Hits an All-Time Low
The On-Balance Volume of PI currently stands at -1.06B. This technical indicator measures buying and selling pressure of a market. On February 26, PI’s OBV was around 566.88M.
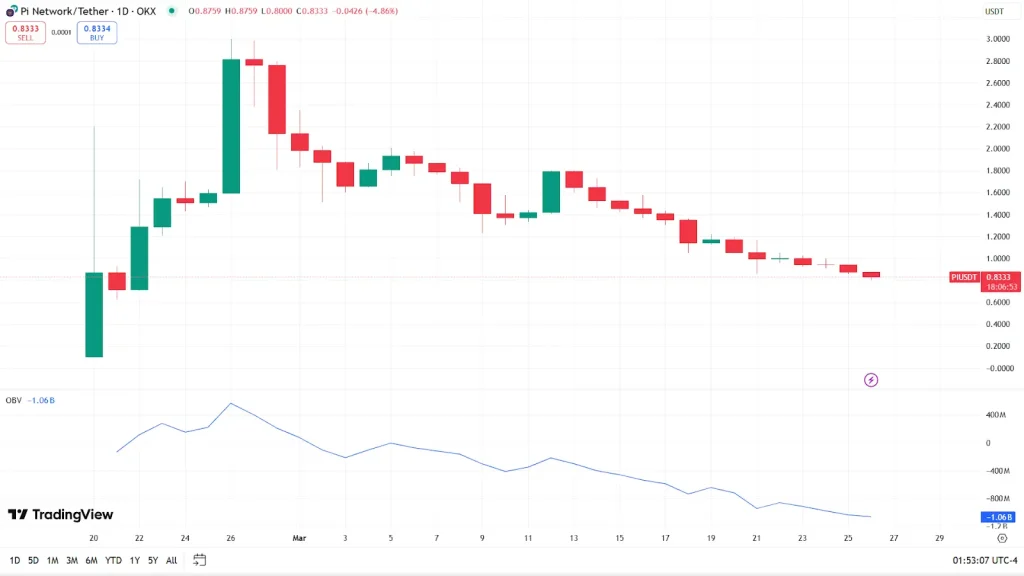
A drop from 566.88M to -1.06B indicates that the PI market has experienced a sharp increase in selling pressure during this period.
PI Chart Pattern Analysis: Descending Parallel Channel Confirms the Bearish Trend
The PI market has been trading in a downward-sloping channel since its all-time high of $3.
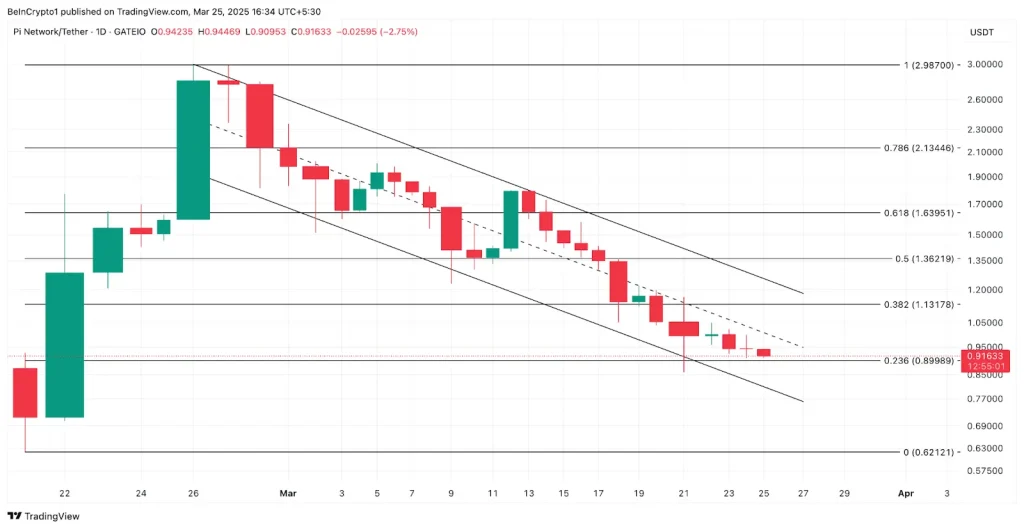
This pattern indicates a clear bearish trend of lower highs and lower lows.
Key Price Levels to Watch in the PI Market
If selling pressure continues, PI could even break below the downward-sloping channel, pulling the price to as low as $0.62.
If buyers regain control, the price could be pushed to a peak of $1.13.
In conclusion, PI’s price remains under pressure as technical indicators point to continued selling. Whether it rebounds or falls further depends on buying interest. Traders should watch for a breakout from the descending channel to determine the next major price move.
Never Miss a Beat in the Crypto World!
Stay ahead with breaking news, expert analysis, and real-time updates on the latest trends in Bitcoin, altcoins, DeFi, NFTs, and more.
FAQs
PI Coin is facing heavy selling pressure due to declining demand, bearish technical indicators, and a lack of buyer interest since February 27.
PI Coin is in a strong downtrend. Investors should watch for trend reversals and key breakout signals before considering an entry.
1
1


 Manage all your crypto, NFT and DeFi from one place
Securely connect the portfolio you’re using to start.

0
0


0
0
