
Solana (SOL) Holds 50-Day EMA as ETF Inflows, MoneyGram Deal Land

0
0

Solana (SOL) is trading near $76.3 today, up close to 0.86% on the day. The token has just broken above a long descending trendline that has capped price action since May.
This Solana price prediction looks at the token's chart setup, recent fund flows, and a fresh payments deal that could shape where SOL heads next.
The breakout comes as SOL builds a base above its short-term moving averages, even as bigger resistance levels sit higher up the chart.
What is Solana's price today?
SOL is changing hands around $76.3, according to derivatives market data. The token has gained $0.65, or 0.86%, over the past 24 hours.
Its market cap sits at $44.40 billion, with a circulating supply of 582.49 million SOL out of a total supply of 632 million tokens. There is no max supply cap listed for Solana.
Spot volume over the past day reached $309.89 million, while futures volume was much higher at $5.55 billion. That gap shows most short-term trading activity is happening in derivatives markets rather than spot.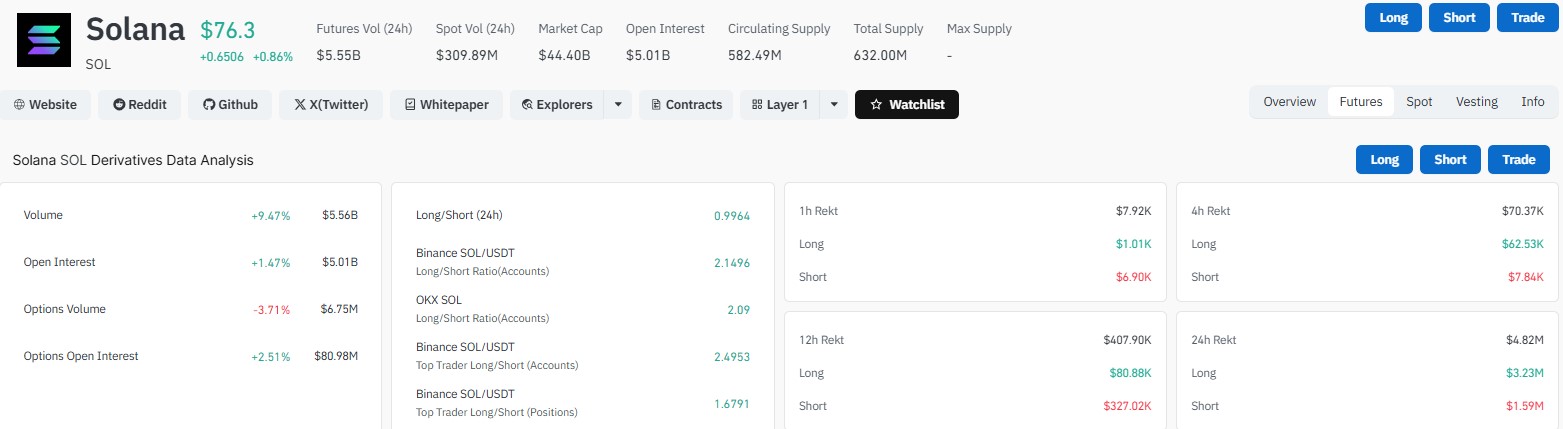
How are Solana futures traders positioned right now?
Open interest in SOL futures stands at $5.01 billion, up 1.47% over the past day. Overall futures volume rose 9.47% to $5.56 billion.
Options activity told a mixed story. Options volume dropped 3.71% to $6.75 million, while options open interest climbed 2.51% to $80.98 million.
The long/short ratio across the past 24 hours sat at 0.9964, meaning positioning is roughly balanced between bulls and bears. On Binance, the SOL/USDT long/short account ratio was more skewed bullish at 2.1496, while OKX showed a similar bullish tilt with a long/short account ratio of 2.09. Top traders on Binance showed a long/short position ratio of 1.6791.
Liquidation data across different timeframes points to shifting pressure. Over the past hour, total liquidations were small at $7.92K, split between $1.01K in longs and $6.90K in shorts.
Over 4 hours, liquidations grew sharply to $70.37K, with shorts taking the bigger hit at $62.53K against $7.84K in longs. The 12-hour window told a similar story, with $407.90K in total liquidations, $327.02K of which came from short positions against $80.88K in longs.
That trend flipped over the full 24-hour period. Long liquidations reached $3.23 million compared to $1.59 million in shorts, a period that also lines up with the broader move higher followed by some pullback.
Timeframe | Total Liquidations | Long | Short |
1h | $7.92K | $1.01K | $6.90K |
4h | $70.37K | $7.84K | $62.53K |
12h | $407.90K | $80.88K | $327.02K |
24h | $4.82M | $3.23M | $1.59M |
Solana technical analysis: what does the daily chart show?
On the daily chart, the most recent candle opened at $76.29, hit a high of $76.60, dipped to a low of $75.99, and closed at $76.04. That marked a small daily decline of $0.25, or 0.33%, on volume of 18.9K.
The daily chart shows price breaking above a descending trendline that had been in place since the May highs near $97.
After the breakout, candles have formed with small bodies and long wicks. That pattern usually means buyers are defending the new breakout zone while sellers are still pushing back near current levels.
SOL is trading above its 20 EMA at $75.04 and 50 EMA at $75.52. Holding above these short-term averages supports the case for near-term bullish structure.
However, price remains below the 100 EMA at $78.39 and the 200 EMA at $89.97. Those longer-term averages mark the next real test for bulls.
The RSI (14) reads 53.93, sitting in neutral territory. This suggests SOL has room to move higher without being overbought, but it is not showing strong momentum either.
Indicator | Level | Price Relation |
20 EMA | $75.04 | Price above |
50 EMA | $75.52 | Price above |
100 EMA | $78.39 | Price below |
200 EMA | $89.97 | Price below |
RSI (14) | 53.93 | Neutral |
A triangle pattern is also visible on the chart, formed by the June low near $59 and the gradual higher lows into August. The recent trendline break sits right at the upper edge of this pattern.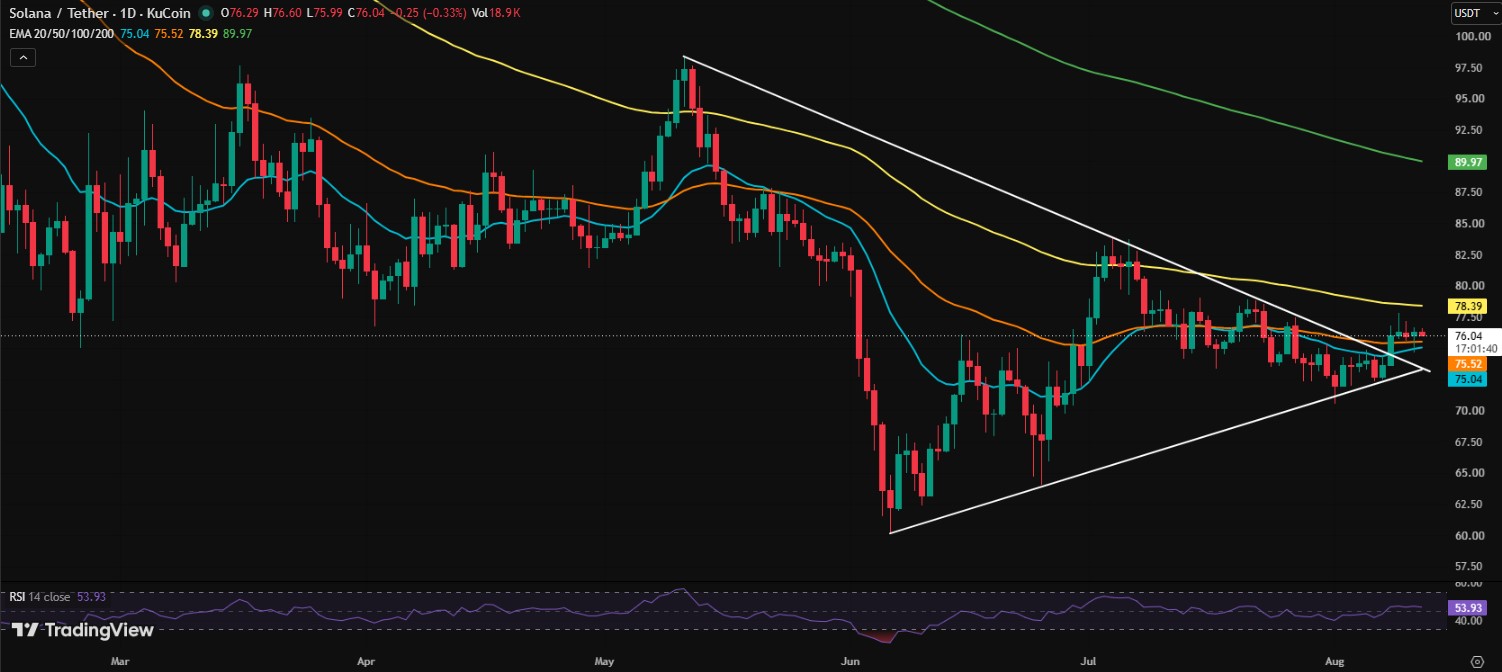
What levels matter for Solana price prediction next?
As long as SOL holds above the breakout trendline and the 20/50 EMA zone near $75, the path toward $80 to $82 stays open. A move beyond that could bring $85 into view.
A daily close above the 100 EMA at $78.39 would add more weight to the bullish case. Volume would need to pick up alongside any such move to confirm real buying interest rather than a weak test of resistance.
On the downside, a break back below the 20 and 50 EMA cluster near $75 would put the recent breakout in question and could open the door back toward the triangle support zone.
Why did MoneyGram's move to Solana matter for SOL?
Solana's official account confirmed that MoneyGram Ramps is now live on the network. MoneyGram brings more than 60 million customers and close to 500,000 retail locations across over 170 countries into reach through a single API for developers building on Solana.
This kind of integration matters because it connects Solana's blockchain rails to one of the largest existing cash-based payment networks in the world. For everyday users, it could mean easier ways to move between cash and crypto using Solana infrastructure.
News like this tends to support the network's long-term utility narrative, separate from short-term price swings.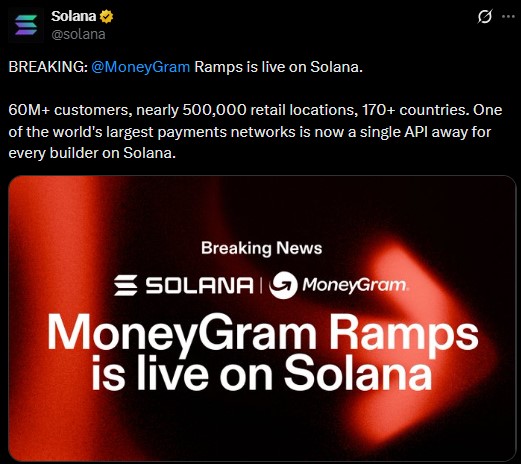
Are ETF flows supporting Solana right now?
Yes, at least modestly. A net inflow of $1.43 million was recorded in SOL ETF products in the most recent session.
That is not a massive number in isolation, but it does show that institutional-style demand has not turned negative, even as SOL trades well off its 2025 highs.
Sustained inflows over multiple sessions would be a stronger signal to watch going forward.
Solana price prediction: bullish and bearish scenarios
Bullish case: SOL holds above $75 support, volume increases, and price clears the 100 EMA at $78.39. This could open a run toward $80 to $82, with $85 as a further target if momentum continues.
Bearish case: SOL fails to hold the 20/50 EMA zone and slips back under $75. This would weaken the breakout and could send price back toward the triangle support area built between June and August.
Traders should watch daily closes above $78.39 and above $80 for confirmation, rather than relying on single wicks or short-term spikes.
Disclaimer
This article is for informational purposes only and does not constitute financial, investment, or trading advice. Cryptocurrency markets are highly volatile and carry significant risk. Prices mentioned reflect data available at the time of writing and can change rapidly. Always conduct your own research before making any investment decisions.
0
0

 Manage all your crypto, NFT and DeFi from one place
Securely connect the portfolio you’re using to start.


0
0

0
0