Buy ETH? Tron Founder Remains Bullish amid Whale Purchases

0
0
Coinspeaker
Buy ETH? Tron Founder Remains Bullish amid Whale Purchases
Tron founder Justin Sun is choosing conviction over capitulation, declaring that he has no intention of selling his Ethereum ETH $1 584 24h volatility: 1.1% Market cap: $191.15 B Vol. 24h: $9.15 B holdings despite bearish sentiment and the cryptocurrency crashing 20% in the last 30 days.
ETH is currently at a low price, but we have no intention of selling our ETH holdings. Tron will continue to seek opportunities to collaborate with more Ethereum developers and build our industry together.
— H.E. Justin Sun 🍌 (@justinsuntron) April 17, 2025
Sun’s public stance not only emphasizes long-term belief in Ethereum but also signals potential upcoming collaboration between Tron TRX $0.24 24h volatility: 0.1% Market cap: $23.24 B Vol. 24h: $639.78 M and Ethereum developers, aiming to jointly push for broader blockchain growth.
Reports suggest Sun personally holds around 665,000 ETH, which is currently valued just under $1 billion, a steep drop from its estimated peak value of $2.5 billion.
Despite the massive markdown, Sun remains steadfast in his decision to HODL, pushing back against growing market fears and a trend of whales offloading ETH in massive numbers.
Ethereum Faces Challenges
While Sun doubles down, the Ethereum network itself is facing a set of challenges. Daily active address metrics remain volatile, with data showing a year-over-year decline of over 11%, down to roughly 450,000 active addresses as of mid-April.
Ethereum’s (ETH) daily active addresses present a mixed picture, introducing uncertainty. While YCharts data showed a year-over-year decline of over 11% to ~450,565 by mid-April 2025, other recent reports noted temporary surges, sometimes exceeding 1 million addresses. This…
— David Gross davidgrossapps (@dgapps) April 17, 2025
Though temporary spikes have occurred, occasionally breaching the one-million mark, the broader picture suggests a fading momentum in consistent user interaction.
Another key indicator of the current Ethereum slowdown is the plunge in gas fees, now at their lowest since 2020. According to Santiment, average transaction fees have dropped to just $0.168, a clear reflection of reduced network demand.
🚨💸 BREAKING: Ethereum fees are at a 5-year low, with transactions currently costing just $0.168. This is the cheapest daily cost of making $ETH transfers since May 2, 2020. We briefly break this down in our latest insight. 👇https://t.co/fg5CfRgsHn pic.twitter.com/QlLwyzdm1F
— Santiment (@santimentfeed) April 16, 2025
ETH Price Analysis
The daily Ethereum chart below shows a downtrend that began in mid-December 2024 and has persisted into April 2025. Also, a potential descending wedge pattern has been forming since around mid-February 2025.
This pattern, characterized by converging lower highs and lower lows, is generally considered a bearish continuation pattern. The more likely future would be ETH breaking down below the lower trendline of the wedge.
Technically, if a breakdown occurs around the current price level of $1575, a potential target could be in the range of $975 ($157-$600).
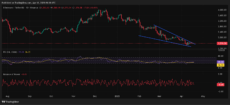
Ethereum Price Chart | Source: TradingView
On the other hand, a bullish case could see ETH breakout above the upper trendline of the descending wedge with strong buying volume. A potential initial target could be the resistance level around the previous swing high near $2200-$2400.
Meanwhile, the Relative Strength Index (RSI) currently reads around 36.31 suggesting that bears are dominating with the gradient of the line suggesting continued sideways movement until volume surges.
The Balance of Power indicator, which aims to measure the strength of buying and selling pressure, currently sits at -0.49. The negative value indicators that sellers have been in control of the price action.
0
0


 Manage all your crypto, NFT and DeFi from one place
Securely connect the portfolio you’re using to start.


0
0

