
Dogecoin Price Prediction July 2026: The Setup Nobody's Watching

0
0

Dogecoin's been quiet for weeks, sitting around an $11.4 billion market cap and going nowhere fast.
Funny thing is, this exact kind of quiet has shown up right before DOGE's biggest moves in the past, and a chart doing the rounds right now is making that case directly.
This Dogecoin price prediction July 2026 gets into why that matters and where the key levels sit.
Bitcoin's holding above $60K and Ethereum's in the high $1,700s, both fairly steady lately, which usually gives DOGE more room to do its own thing.
What's the liquidation data actually showing?
As Per Data Taken From Coinglass. The numbers over the past day lean pretty hard in one direction.
Roughly $1.96M in DOGE positions got liquidated over 24 hours, and most of that, about $1.79M, was longs, with shorts only eating around $165.77K. 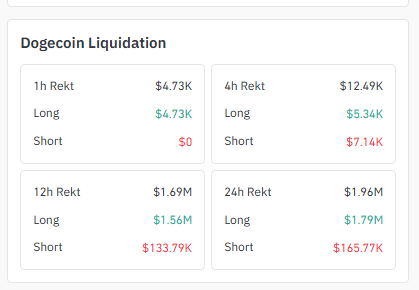
Same deal on the 12-hour window: $1.56M in long liquidations against a much smaller $133.79K in shorts.
Shorter timeframes tell a slightly different story, though. On the 4-hour chart, shorts actually took a bit more damage than longs ($7.14K vs. $5.34K), and on the 1-hour, it flipped entirely to longs ($4.73K, shorts at zero).
That mix is kind of interesting; it looks less like one side getting steamrolled and more like actual back-and-forth fighting happening right now, even if the 24-hour total still tilts toward longs overall.
Where's All This Volume Coming From?
DOGE's volume is pretty concentrated when you look at it.
Binance is carrying most of it at around $232.46M, with OKX not far behind at roughly $166.21M. 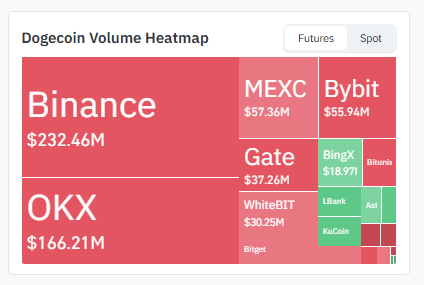
Source: Heatmap Data Taken From Coinglass
After that it's MEXC ($57.36M) and Bybit ($55.94M), then Gate ($37.26M), WhiteBIT ($30.25M), and BingX ($18.97M), with Bitunix, LBank, KuCoin, and Bitget picking up smaller amounts.
That kind of concentration on Binance and OKX isn't really a warning sign here; both are deep, liquid books, and DOGE's always traded that way.
Just worth knowing that most of the real price discovery is happening on those two exchanges rather than spread evenly across the board.
The 4-Hour Chart: A Triangle That's Quietly Coiling Tighter
DOGE is trading around $0.07226 right now on the 4-hour, and it's been squeezing inside a symmetrical triangle.
While usually a sign something's building underneath, especially with price action showing a bit more life than the dead stretch before it.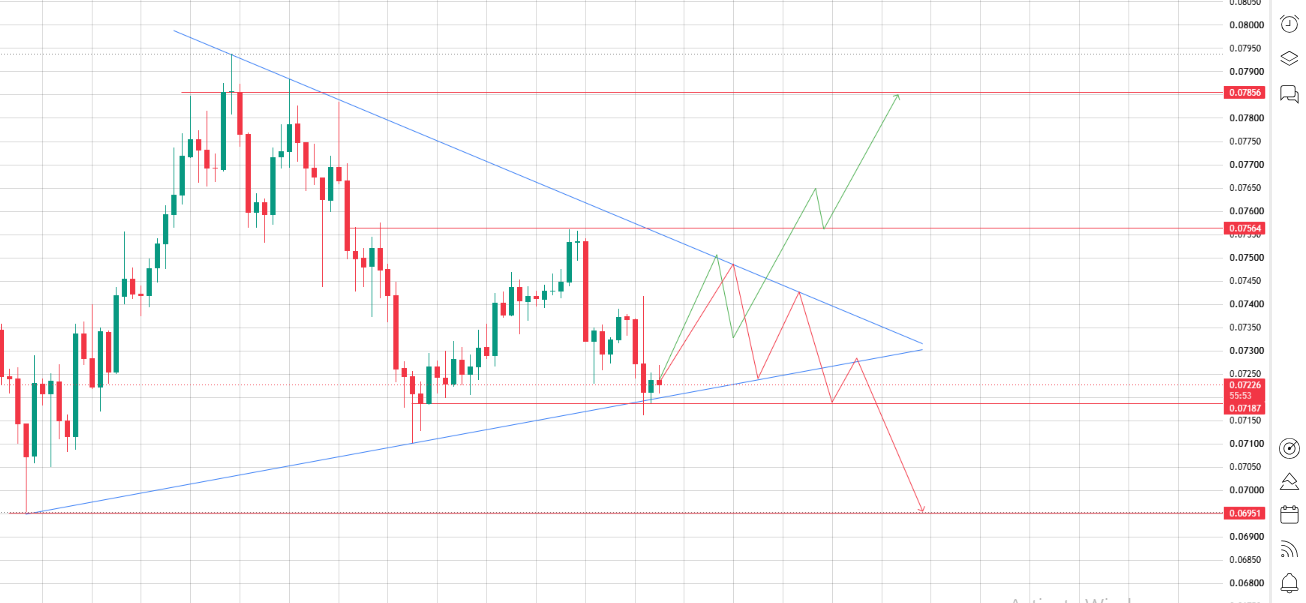
Source: Chart Taken From TradingView.
Price has been respecting that triangle the whole way, which is actually supporting the broader trend rather than fighting it.
Immediate support sits at $0.07187, and $0.06951 is the deeper level underneath if things really give way. On the upside, $0.07564 is the first thing to watch, with $0.07856 after that
| Level Type | Price (USD) | What It Means |
|---|---|---|
| Resistance 2 | $0.07856 | Next target if the breakout keeps going. |
| Resistance 1 | $0.07564 | The first hurdle; it needs real volume behind it to clear. |
| Support 1 | $0.07187 | Immediate support inside the triangle. |
| Deep Support (Invalidation) | $0.06951 | Below this, the whole setup needs rethinking. |
A clean break above $0.07564 with decent volume behind it would probably build momentum toward $0.07856.
If it can't hold above that first resistance, don't be surprised by some consolidation or profit-taking before the next real move happens.
And if the price breaks down below $0.07187 instead, that weakens the structure and opens the door to more downside, though it's not fully invalidated until a close under $0.06951.
Either way this resolves, it's going to need actual volume behind it to stick.
The Daily Chart: Still Boxed Inside A Falling Channel
Zoom out to the daily, and DOGE's been stuck inside a pretty clean descending channel for weeks now, every bounce getting sold, price slowly grinding toward the channel floor.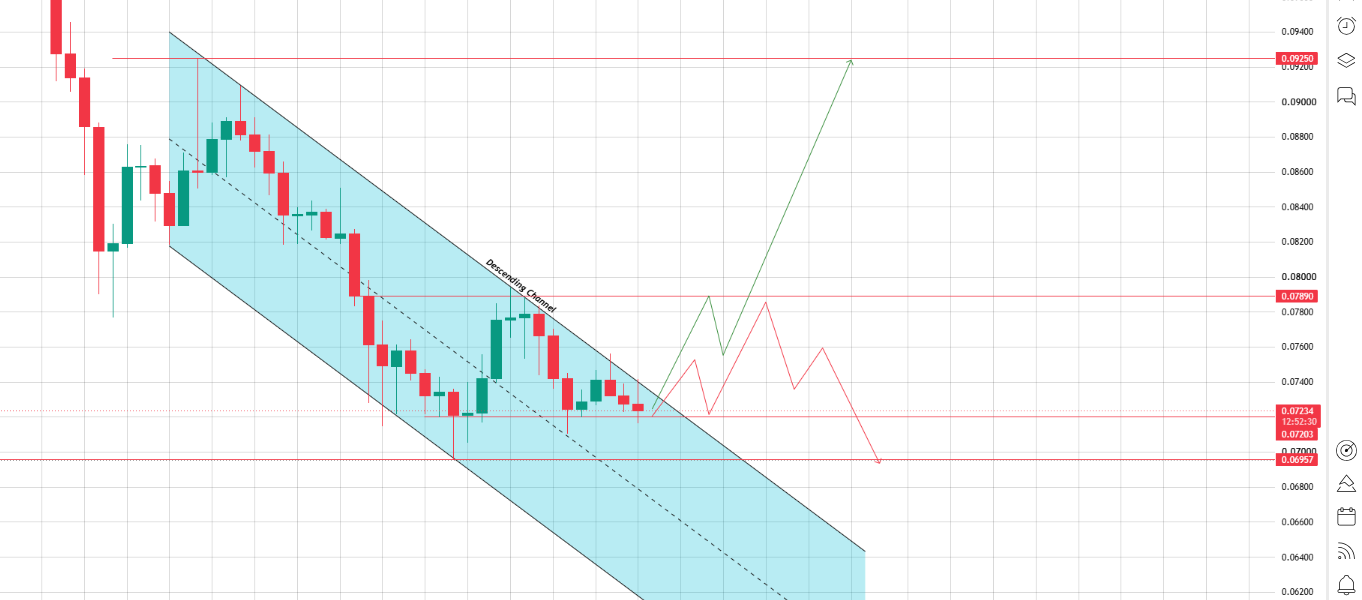
Source: Chart Taken From TradingView.
| Level Type | Price (USD) | What It Means |
|---|---|---|
| Major Resistance (Bull Target) | $0.09250 | Target if the channel actually breaks upward. |
| Resistance 1 | $0.07890 | First hurdle above the channel. |
| Support 1 | $0.07203 – $0.07234 | Right around where price is sitting now, near the channel floor. |
| Deep Support (Invalidation) | $0.06957 | Below this, the bearish case takes full control. |
Break above the channel's upper boundary, and $0.07890 is the first real target, with $0.09250 in play if momentum actually builds.
Stay stuck inside it or break the lower boundary instead, and $0.06957 becomes the level to watch a close below that basically confirms this has turned properly bearish rather than just consolidating.
Bottom line on this timeframe: DOGE is sitting right at a fork in the road. Break up, and the accumulation-zone story gets some real technical backing.
Break down, and it's just another leg lower in what's already been a rough few weeks.
The Chart Everyone's Sharing Right Now
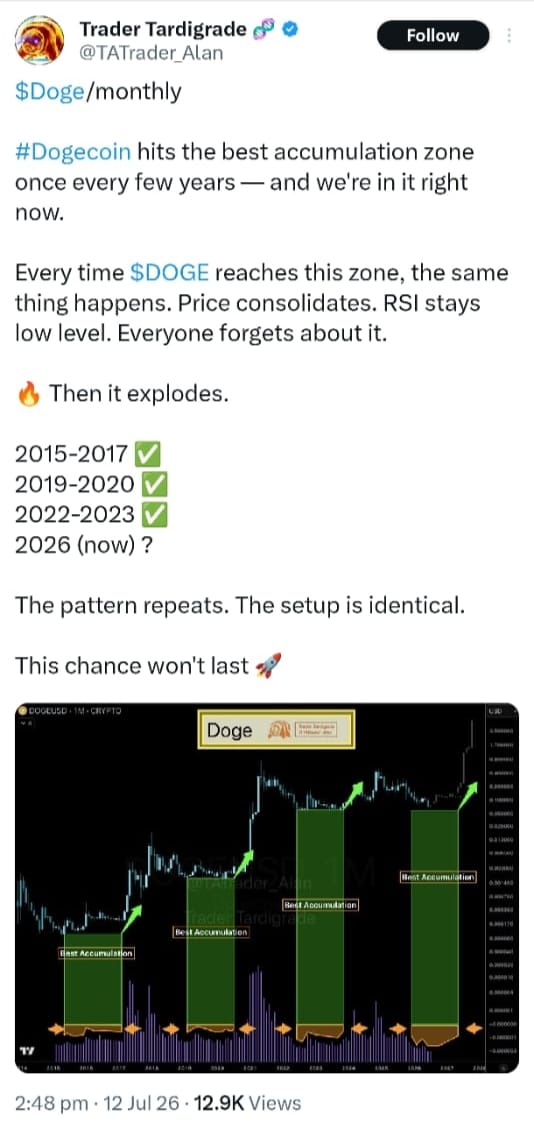
There's a tweet floating around from a trader who's clearly spent a lot of time staring at DOGE's long-term chart, and honestly, the pattern he's pointing at is hard to unsee once you notice it.
His argument, boiled down, is that every few years, Dogecoin hits what he's calling the "best accumulation zone"; the price goes flat, the RSI drops low, and basically everyone stops paying attention.
Source: Data Taken From X
Then it explodes. He's got 2015–2017, 2019–2020, and 2022–2023 marked out as the last three times this exact setup showed up right before DOGE's biggest runs. And his read is that right now, in 2026, it's happening again.
No idea if it repeats a fourth time; nobody does.
But it's exactly the kind of narrative that pulls eyes back to a coin right as the charts start twitching too, which is sort of what's happening here.
Bottom Line
Dogecoin's sitting in a spot that's happened before: quiet price, low RSI, and nobody paying attention, and that's the exact kind of setup that's come right before its bigger runs historically.
Both the 4-hour triangle and the daily channel are compressing at the same time, and whichever way they break is probably going to set the tone for DOGE over the next few weeks.
None of this is guaranteed, obviously.
Accumulation zones don't automatically turn into explosive moves just because they've done it three times before, and a descending channel can break down just as easily as it can break up.
Keep an eye on $0.07564 on the 4-hour and the channel boundaries on the daily those are the levels that'll actually tell you which way this thing goes.
Disclaimer: This article is for informational purposes only and should not be considered financial or investment advice. Cryptocurrency markets are highly volatile and unpredictable. Always do your own research and consult a licensed financial advisor before making any investment decisions. Past performance is not indicative of future
0
0

 Управляйте всей своей криптовалютой, NFT и DeFi из одного места
Безопасно подключите используемый вами портфель для начала.

0
0

0
0

0
0

0
0