Aptos (APT) Price Breakout Pattern Suggests 197% Rally as Ecosystem Metrics Soar

0
0

NAIROBI (CoinChapter.com) — Aptos (APT) could be heading for a 197% rally as its price shows a potential breakout while key ecosystem metrics continue to trend upward. Data from TradingView shows APT breaking out from a falling wedge pattern, typically viewed as a bullish reversal signal. This technical setup comes as the network reports sharp growth across active users, total value locked (TVL), and staking activity.
Aptos’ Breakout Pattern Aligns With Market Reversal Hopes
APT price bounced off long-term support near $3.40 last week and now trades near $4.57. According to TradingView weekly chart, this recovery could confirm a falling wedge breakout, hinting at a 197% upside target near $13.50.
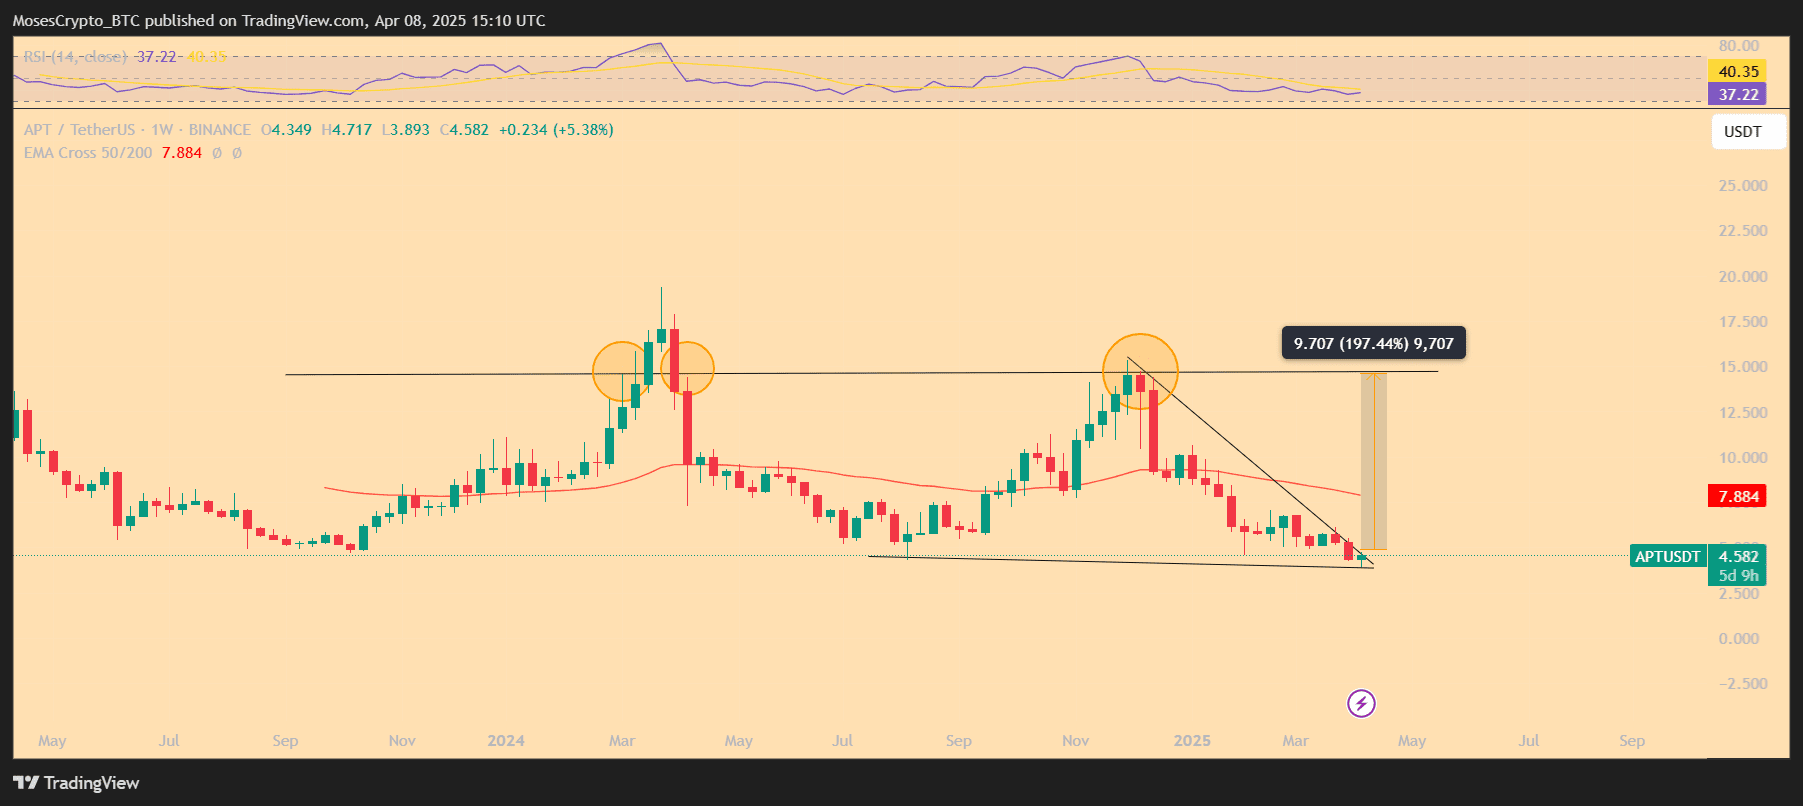
This price projection reflects the wedge’s maximum height from its top near $9.70 in Nov. 2024 to the bottom near $3.27 in Mar. 2025. A similar breakout pattern previously triggered a rally in early 2024 before bulls lost momentum near the $10.50 mark.
The weekly relative strength index (RSI) also supports a recovery narrative. The RSI hovers near 37.2—below the neutral 50 mark but showing signs of reversal. Continued buying pressure could push APT back above the key 50-week exponential moving average near $7.88, which has acted as resistance since Feb.
Aptos’ On-Chain Growth Strengthens Technical Setup
While the price setup hints at upside, on-chain metrics suggest broader network strength. According to CryptoBusy, Aptos recorded an average of 1.11 million daily active accounts in March 2025. Monthly active accounts stood at 14 million, reflecting a rise in user engagement.
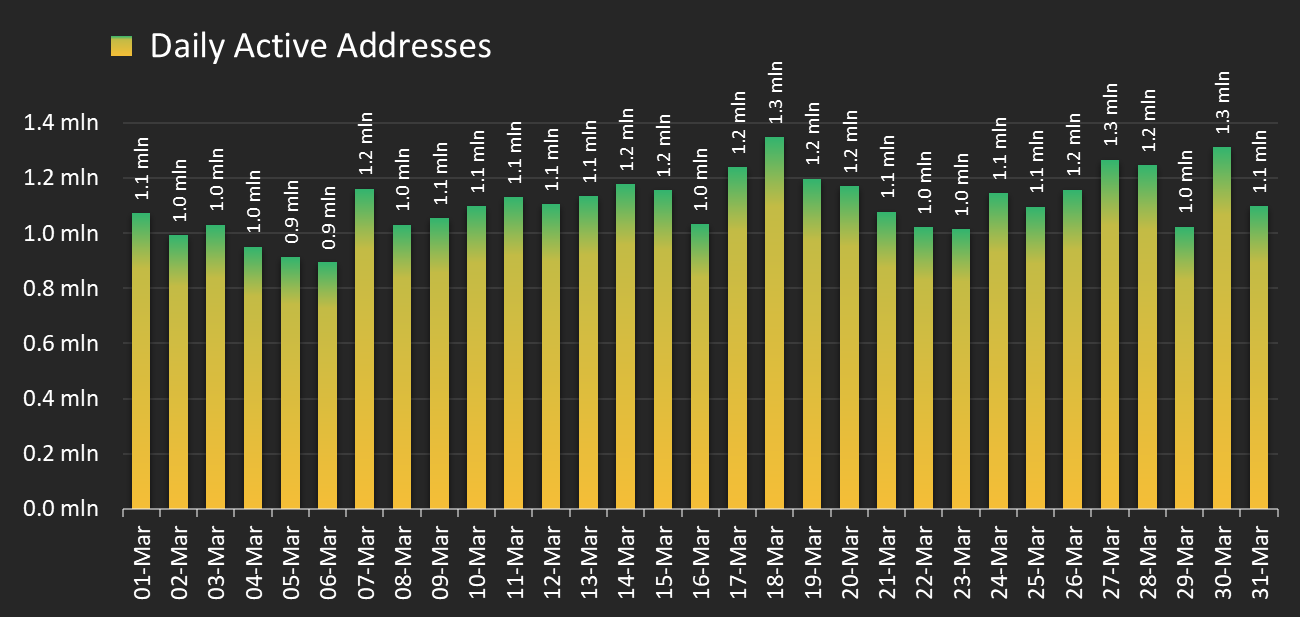
The protocol also added 175,000 new accounts daily, indicating consistent adoption. Transaction activity followed suit, with Aptos users executing 2.84 million daily transactions in Mar., amounting to 88.2 million over the month.
Total value locked (TVL) on Aptos hovered around $0.99 billion in base value, while liquid staking and borrowed assets pushed total TVL to $1.3 billion and $1.9 billion, respectively, per DeFiLlama.
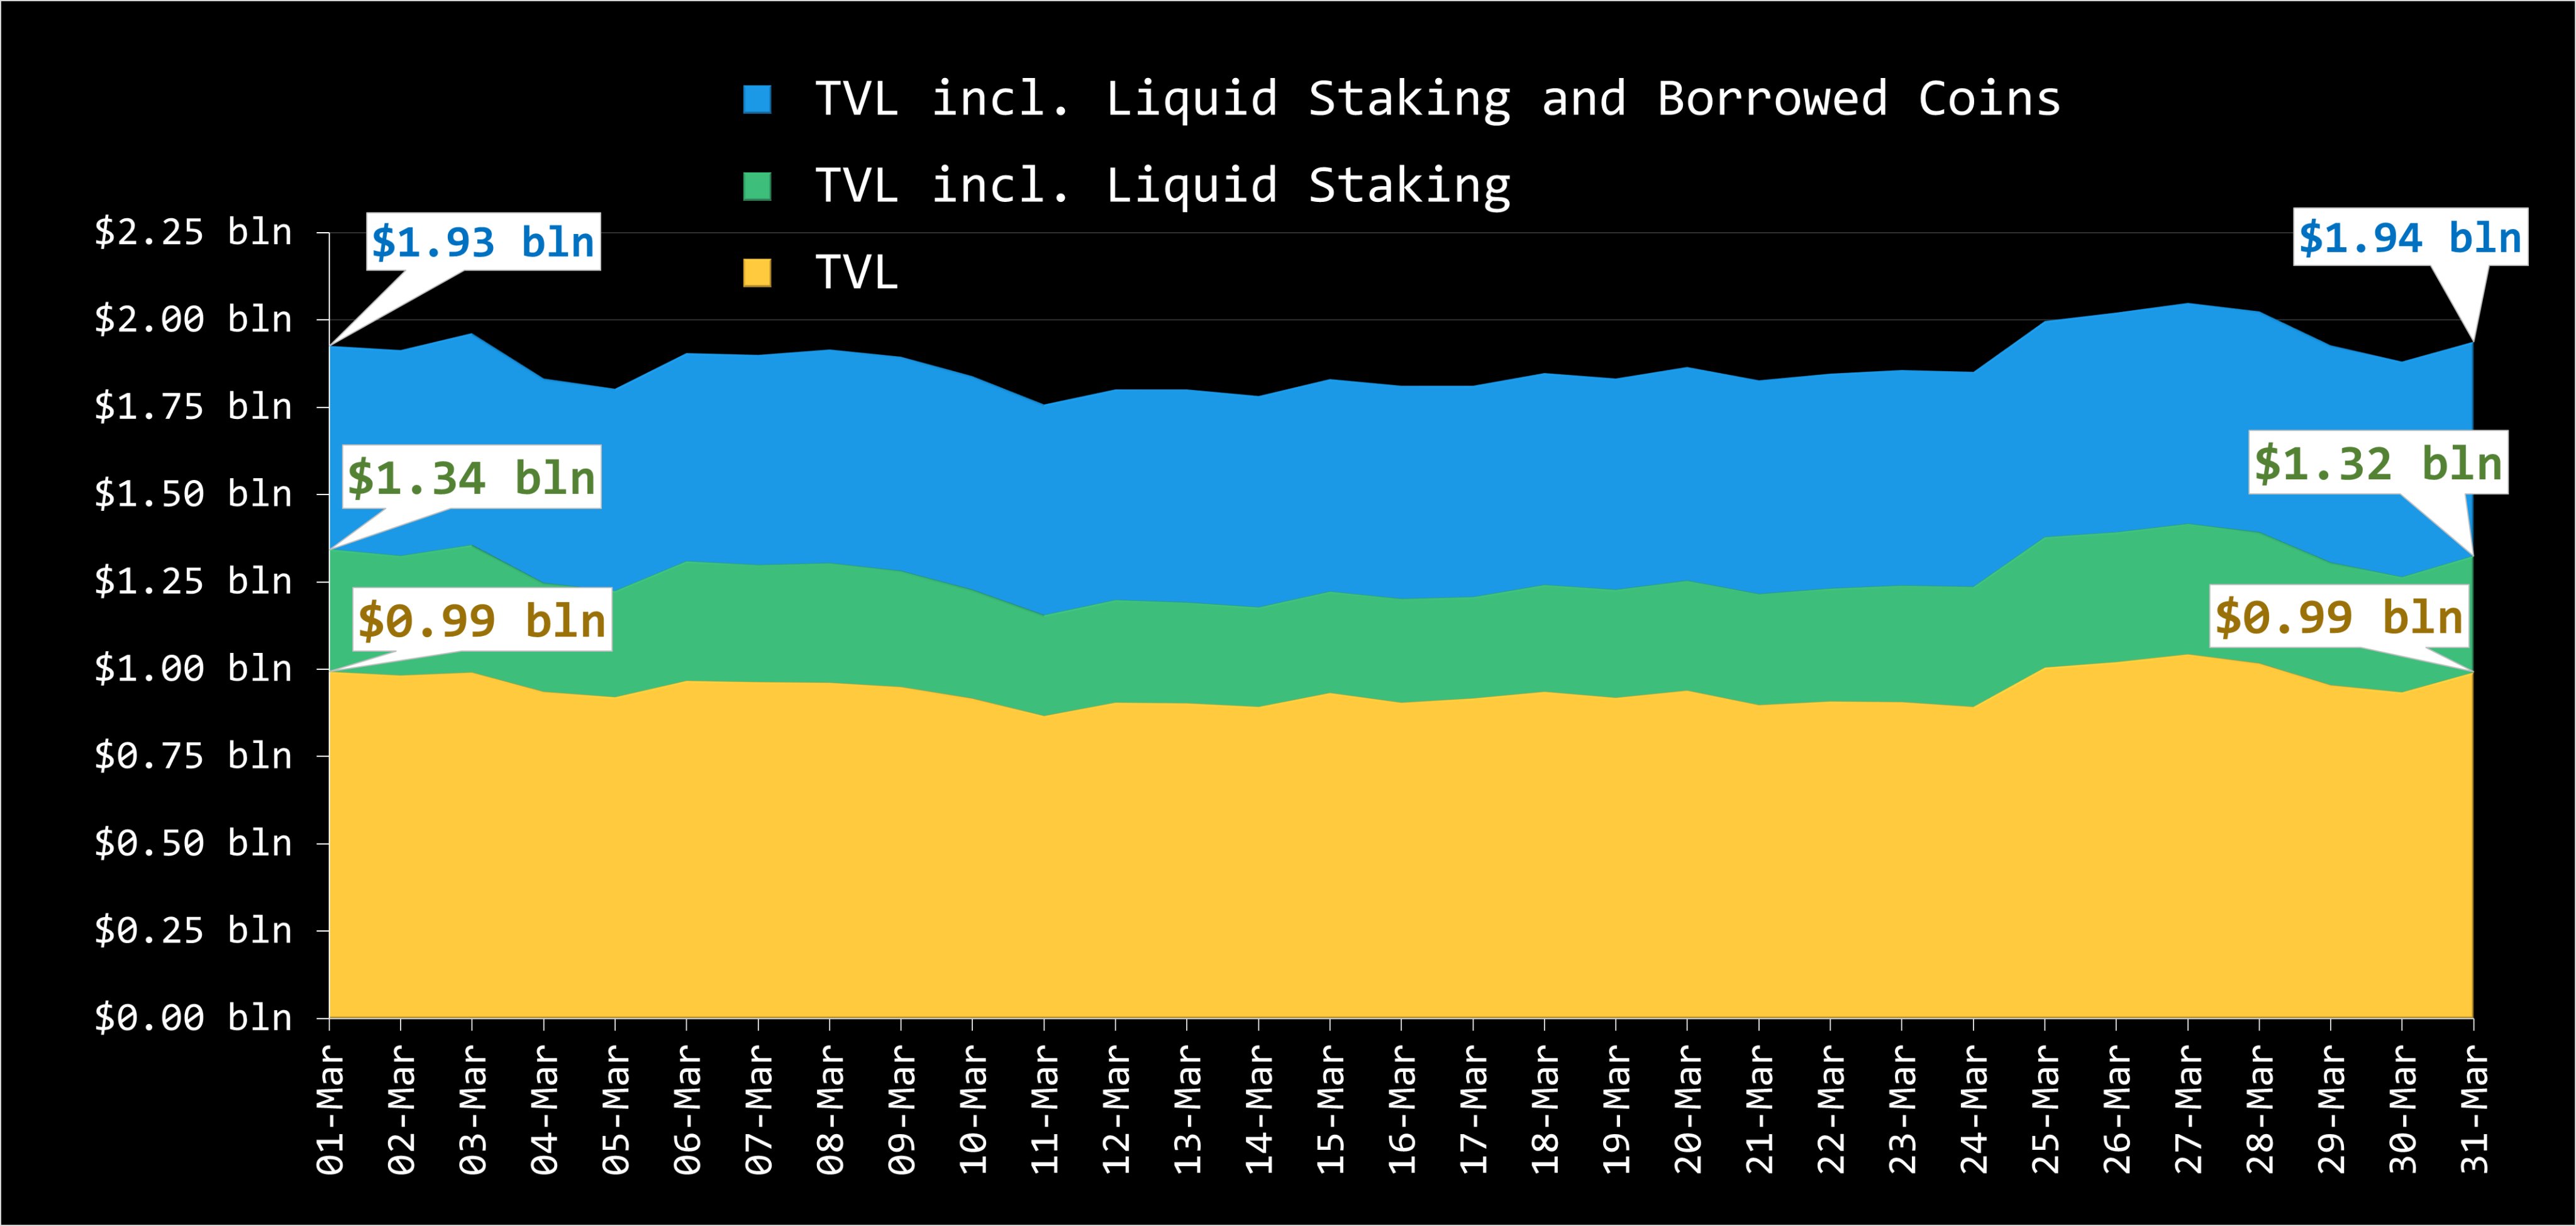
These figures reflect consistent usage rather than short-term hype. “Aptos is quietly building. These metrics show serious traction, not just hype,” CryptoBusy wrote on X.
Staking and Delegation Growth Adds Network Confidence
Staking data reveals further strength in user participation and decentralization. As of early April, 393.1 million APT tokens were delegated across 68 validator nodes. This accounts for 44.6% of the total APT supply of 881.5 million.
More than 54,000 delegators contributed to the staking pool, showcasing growing investor confidence in Aptos’ consensus and incentive models. Increased delegation typically reduces token circulation, which may contribute to upward price pressure if demand holds steady.
Leading liquid staking protocols on Aptos include Amnis Finance with $214 million staked, Thala Labs with $58 million, and TruFin Protocol with $55 million. Their presence highlights the expansion of staking infrastructure on the chain.
Ecosystem Metrics Could Support Long-Term Upside
Growth in core metrics aligns with broader investor interest in layer-1 chains with low fees and high throughput. Aptos, which leverages the Move programming language and claims faster execution times, has seen renewed attention as users search for alternatives to Ethereum.
Although short-term price action remains tied to broader market sentiment, the ecosystem’s stability offers a base for further upside. Aptos’ growth in wallets, users, and locked capital supports the notion of organic demand rather than speculation-driven spikes.
The breakout pattern suggests a technical floor forming, but confirmation will require APT closing above the descending trendline and maintaining strength above $5.00. Should that happen, the next major test lies near the $7.88 level, the 50-week EMA.
Conclusion
Aptos combines a bullish breakout setup with rapid ecosystem expansion. With on-chain metrics pointing to higher usage, deeper liquidity, and increased staking participation, APT could attract more buyers in the coming weeks.
The current setup positions Aptos as one of the few layer-1 tokens showing technical and fundamental alignment. However, a sustained breakout will depend on broader crypto market conditions, including Bitcoin’s direction and macroeconomic sentiment.
Still, the wedge pattern, coupled with real user activity and nearly $2 billion in TVL, strengthens the case for a continued price recovery toward the $13.50 mark in 2025.
0
0

 Manage all your crypto, NFT and DeFi from one place
Securely connect the portfolio you’re using to start.


0
0

