Pi Network Prints First Major Bullish Signal Since July 1 — What’s Next?

1
0

PI Network bulls appear to be making a comeback, thanks to an improvement in overall market sentiment over the past 24 hours.
The token’s price has climbed by 4% in the past 24 hours, sparking speculation about whether a new bullish phase is about to begin.
Buy Pressure Builds in PI
PI’s 4% uptick has triggered a bullish crossover on its Moving Average Convergence Divergence (MACD). For context, the token’s MACD line (blue) has just crossed above its signal line (orange) for the first time since July 1, signaling growing bullish momentum.
The MACD indicator identifies trends and momentum in its price movement. It helps traders spot potential buy or sell signals through crossovers between the MACD and signal lines.
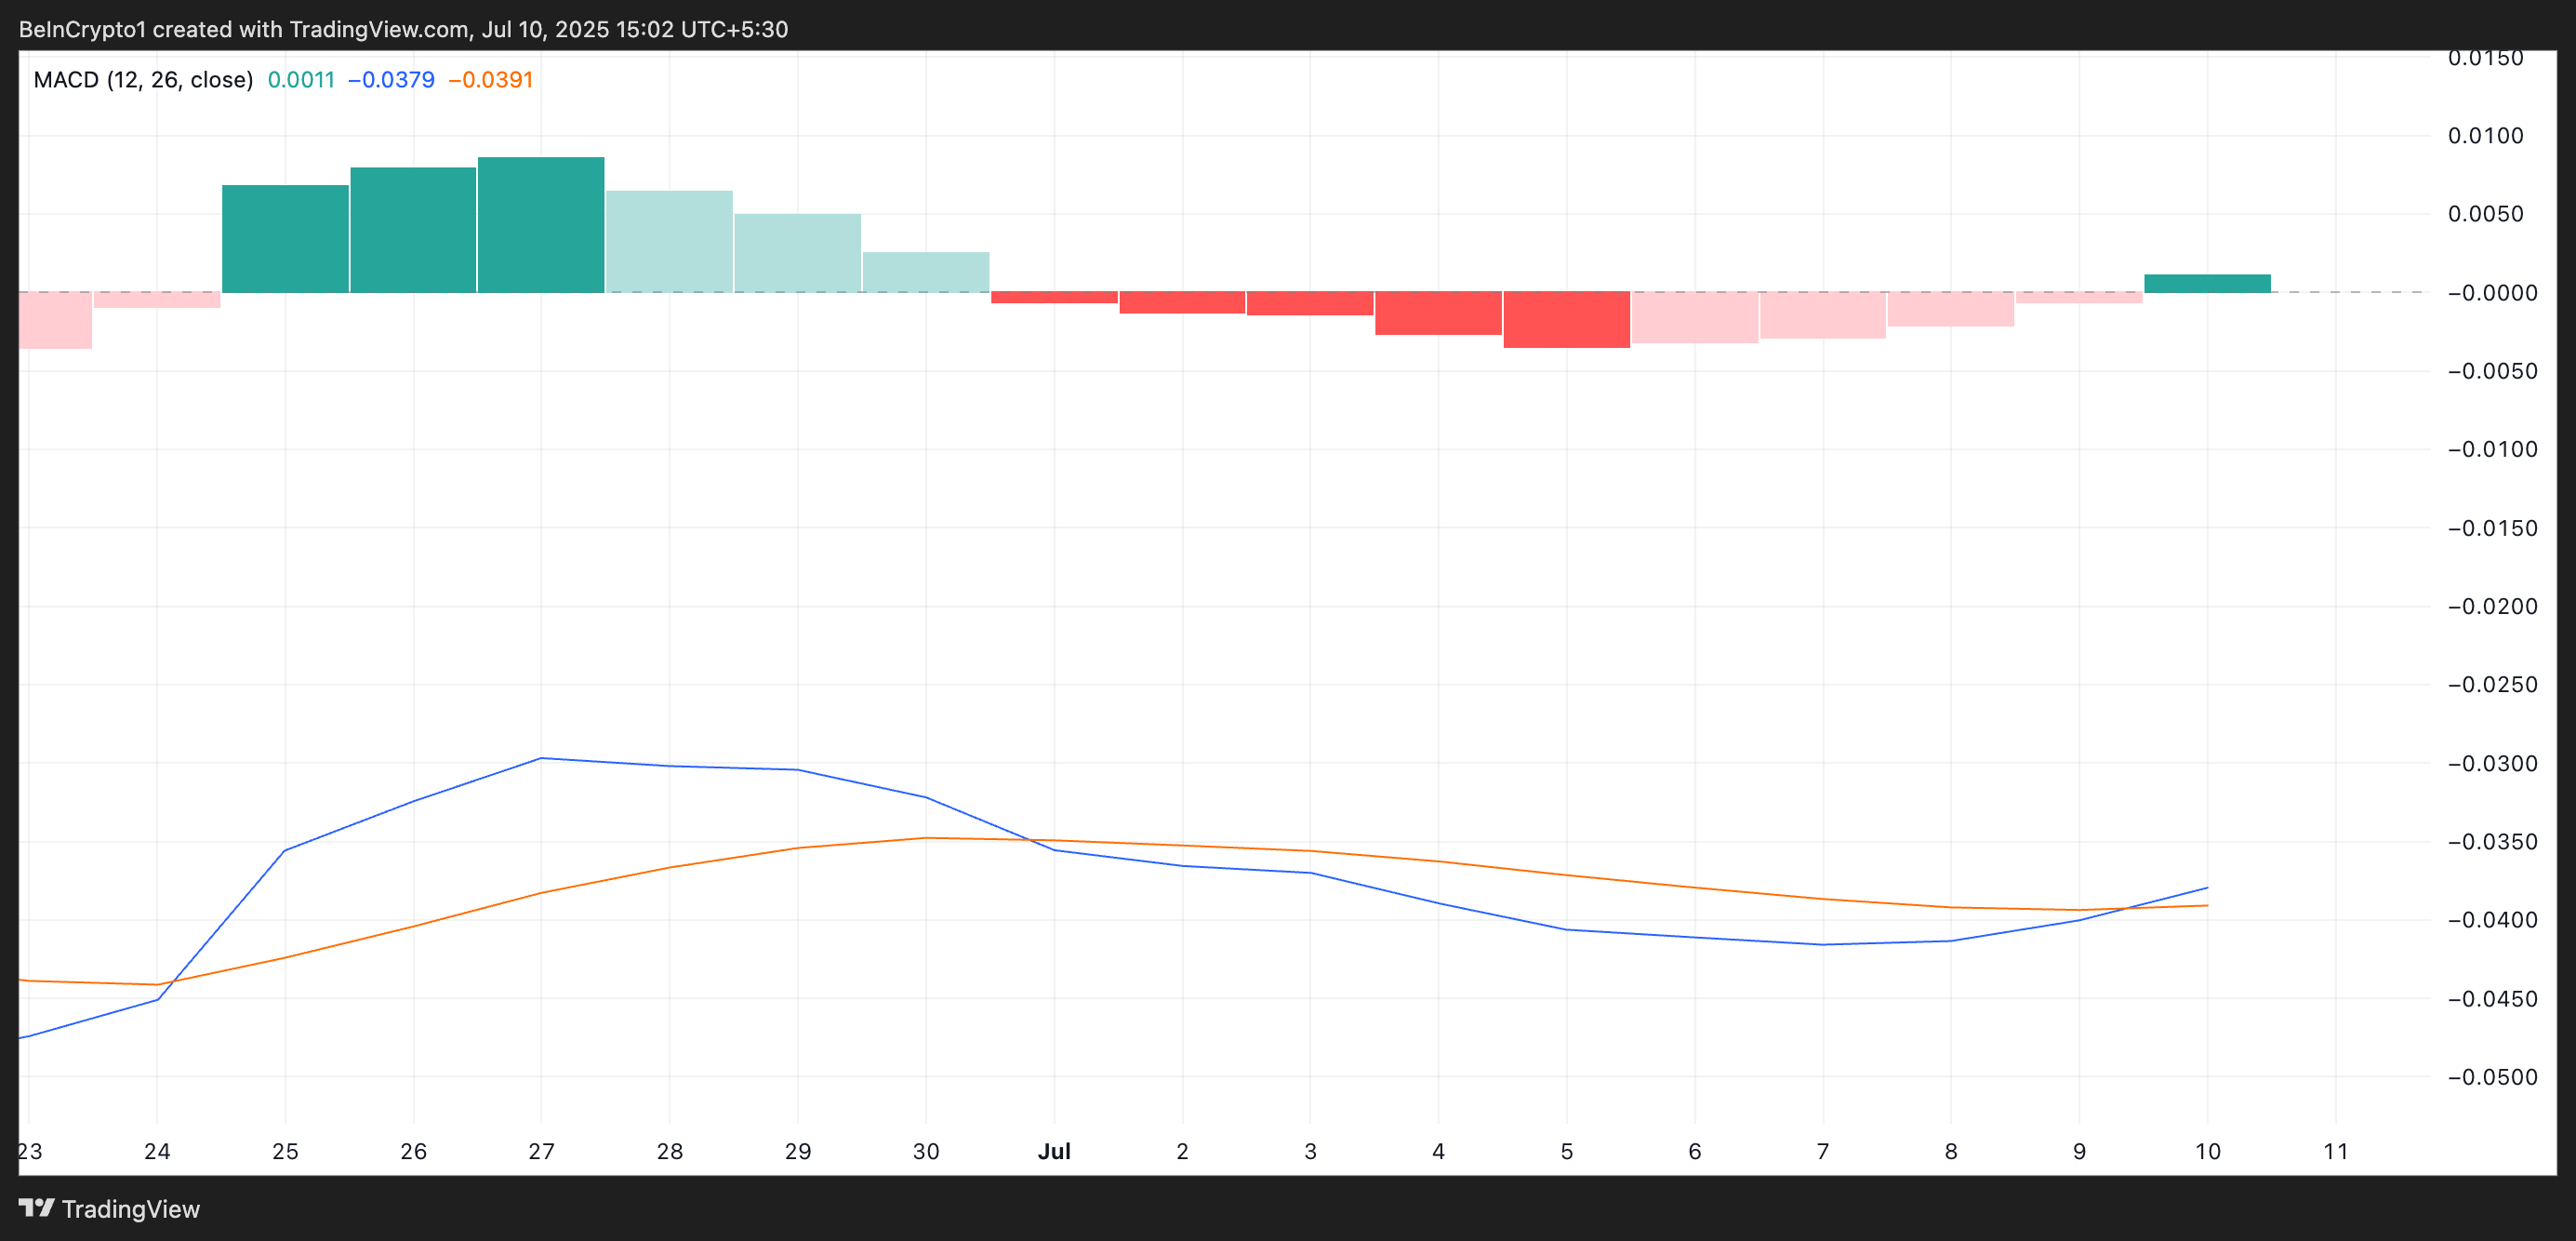 PI MACD. Source: TradingView
As with PI, when the MACD line crosses above the signal line, it signals bullish momentum, suggesting that buying activity is increasing. Traders interpret this setup as a buy signal, which could add more upward pressure on the meme coin’s price.
While PI’s MACD and signal lines remain below zero because of its prolonged bearish trend, this crossover highlights a cooldown in selloffs as bulls attempt to regain market control.
Further, readings from the PI/USD one-day chart show its Balance of Power (BoP) at 0.61, indicating that buy-side pressure is gaining strength.
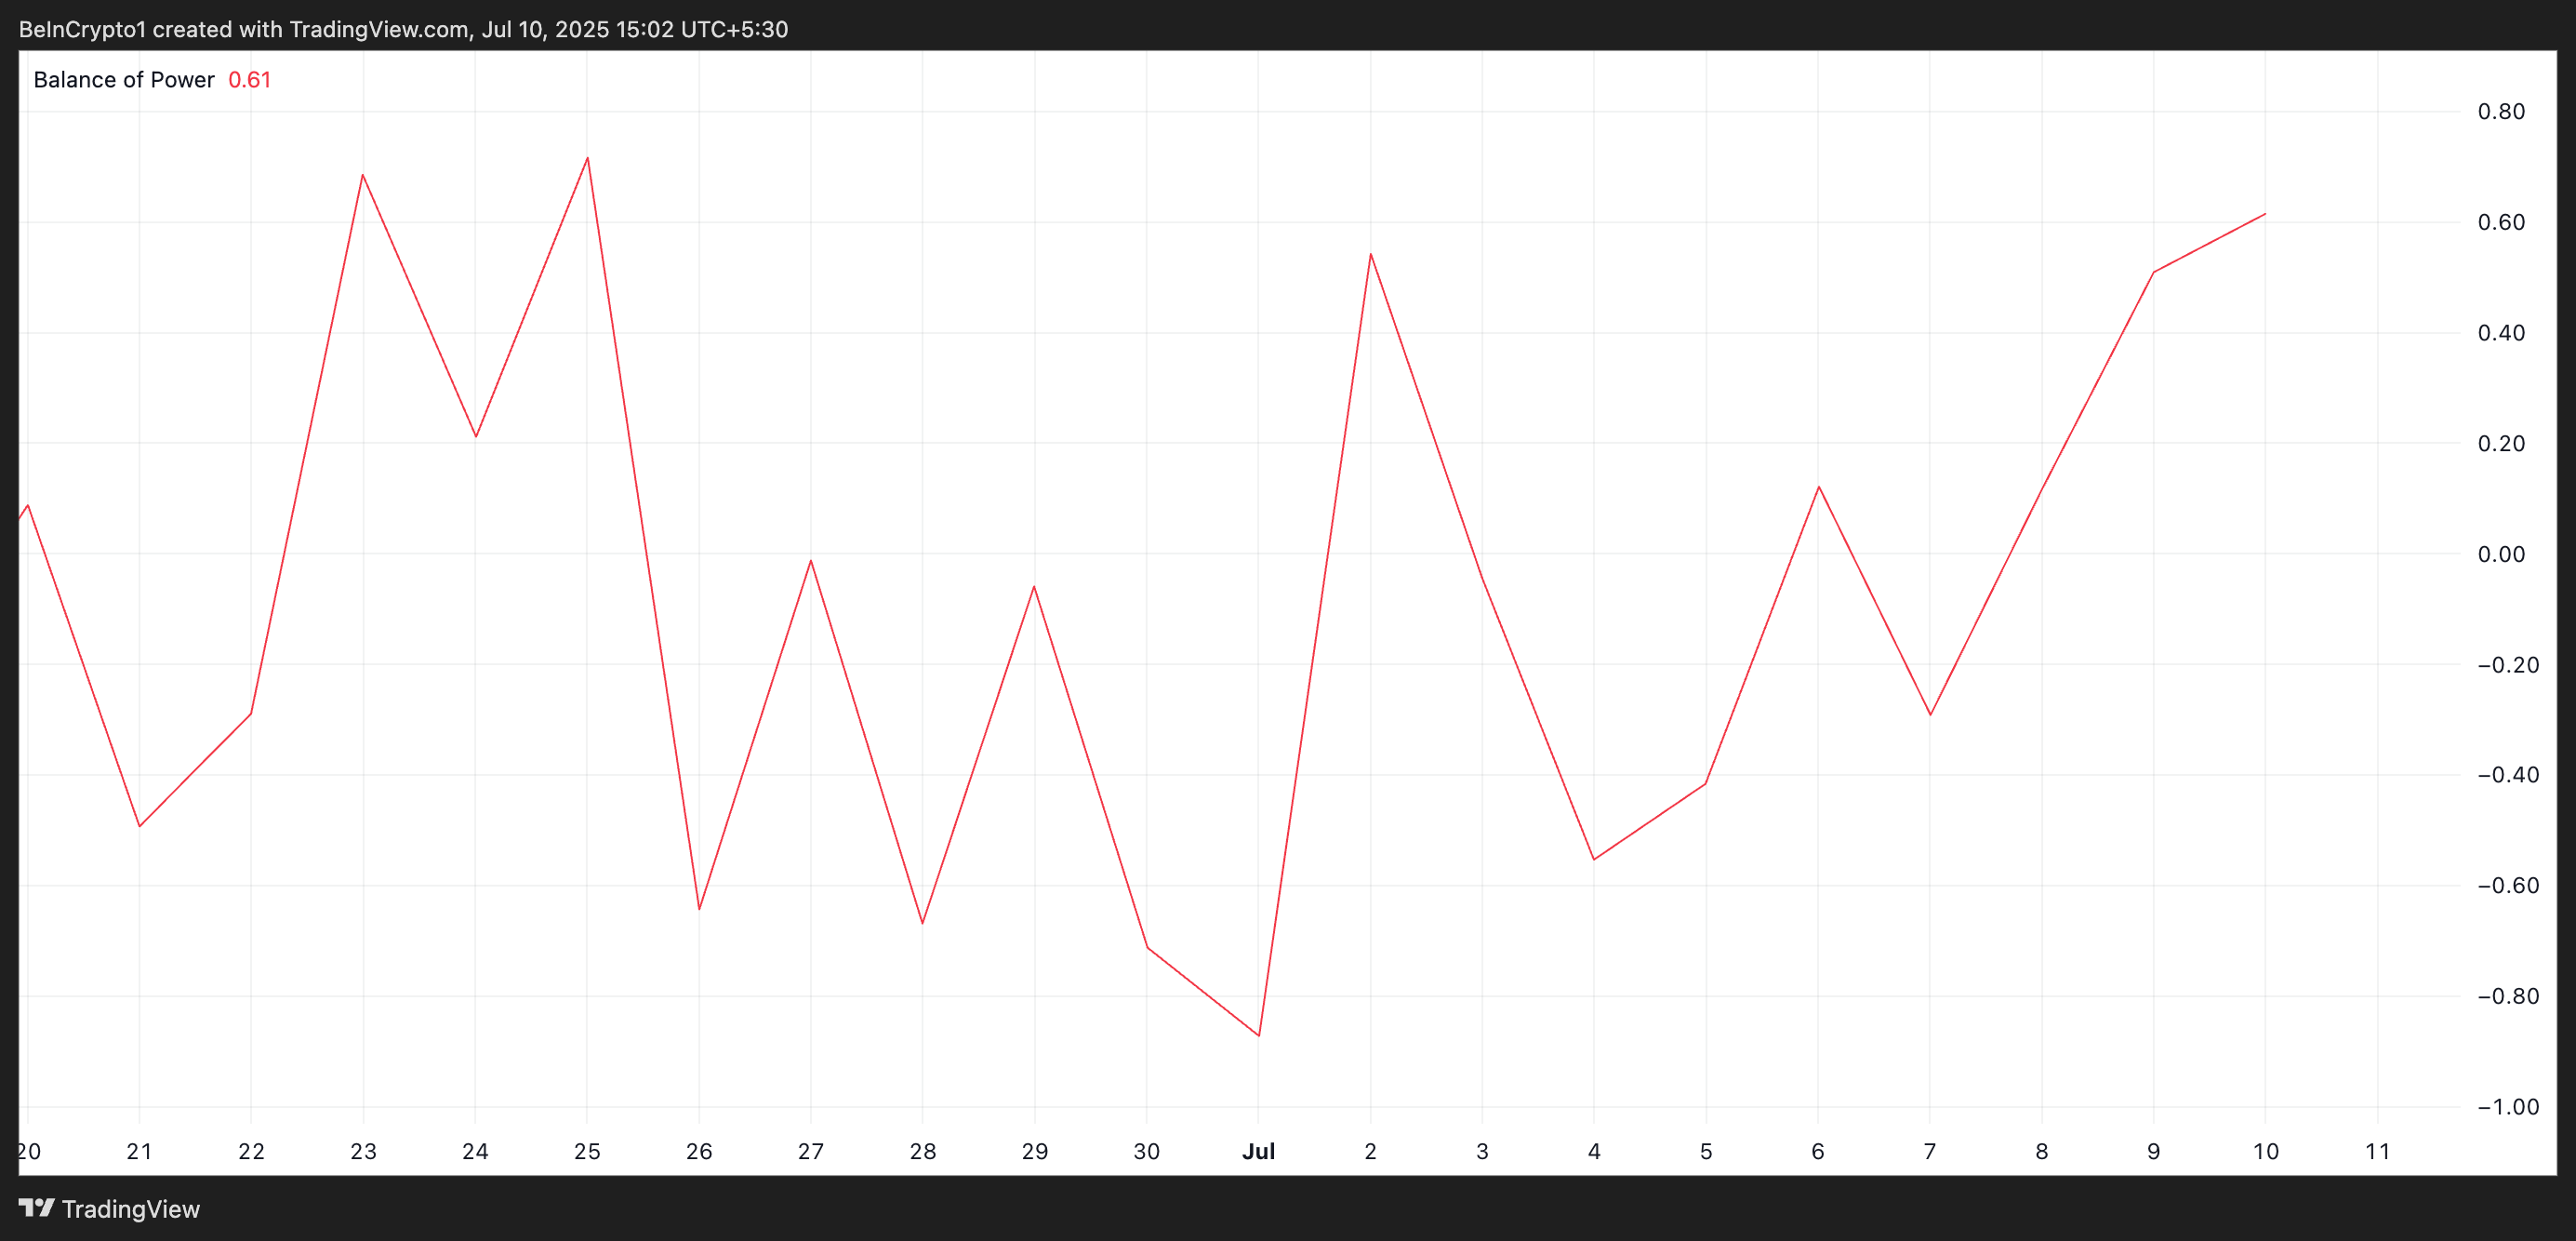 PI BoP. Source: TradingView
The BoP indicator measures the strength of buyers versus sellers in the market, helping to identify momentum shifts. When its value is negative, sellers dominate the market, with little to no buyer resistance.
Conversely, positive BOP readings like this suggest buyers dominate the market over sellers and drive newer price gains.
Can Buying Pressure Carry PI Across the Line?
PI currently trades below resistance at $0.477. If demand climbs, the altcoin could flip this barrier into a support floor, propelling its price toward $0.508.
However, for PI to sustain this upward momentum and push toward higher resistance levels, there must be a significant influx of new demand to absorb the existing supply.
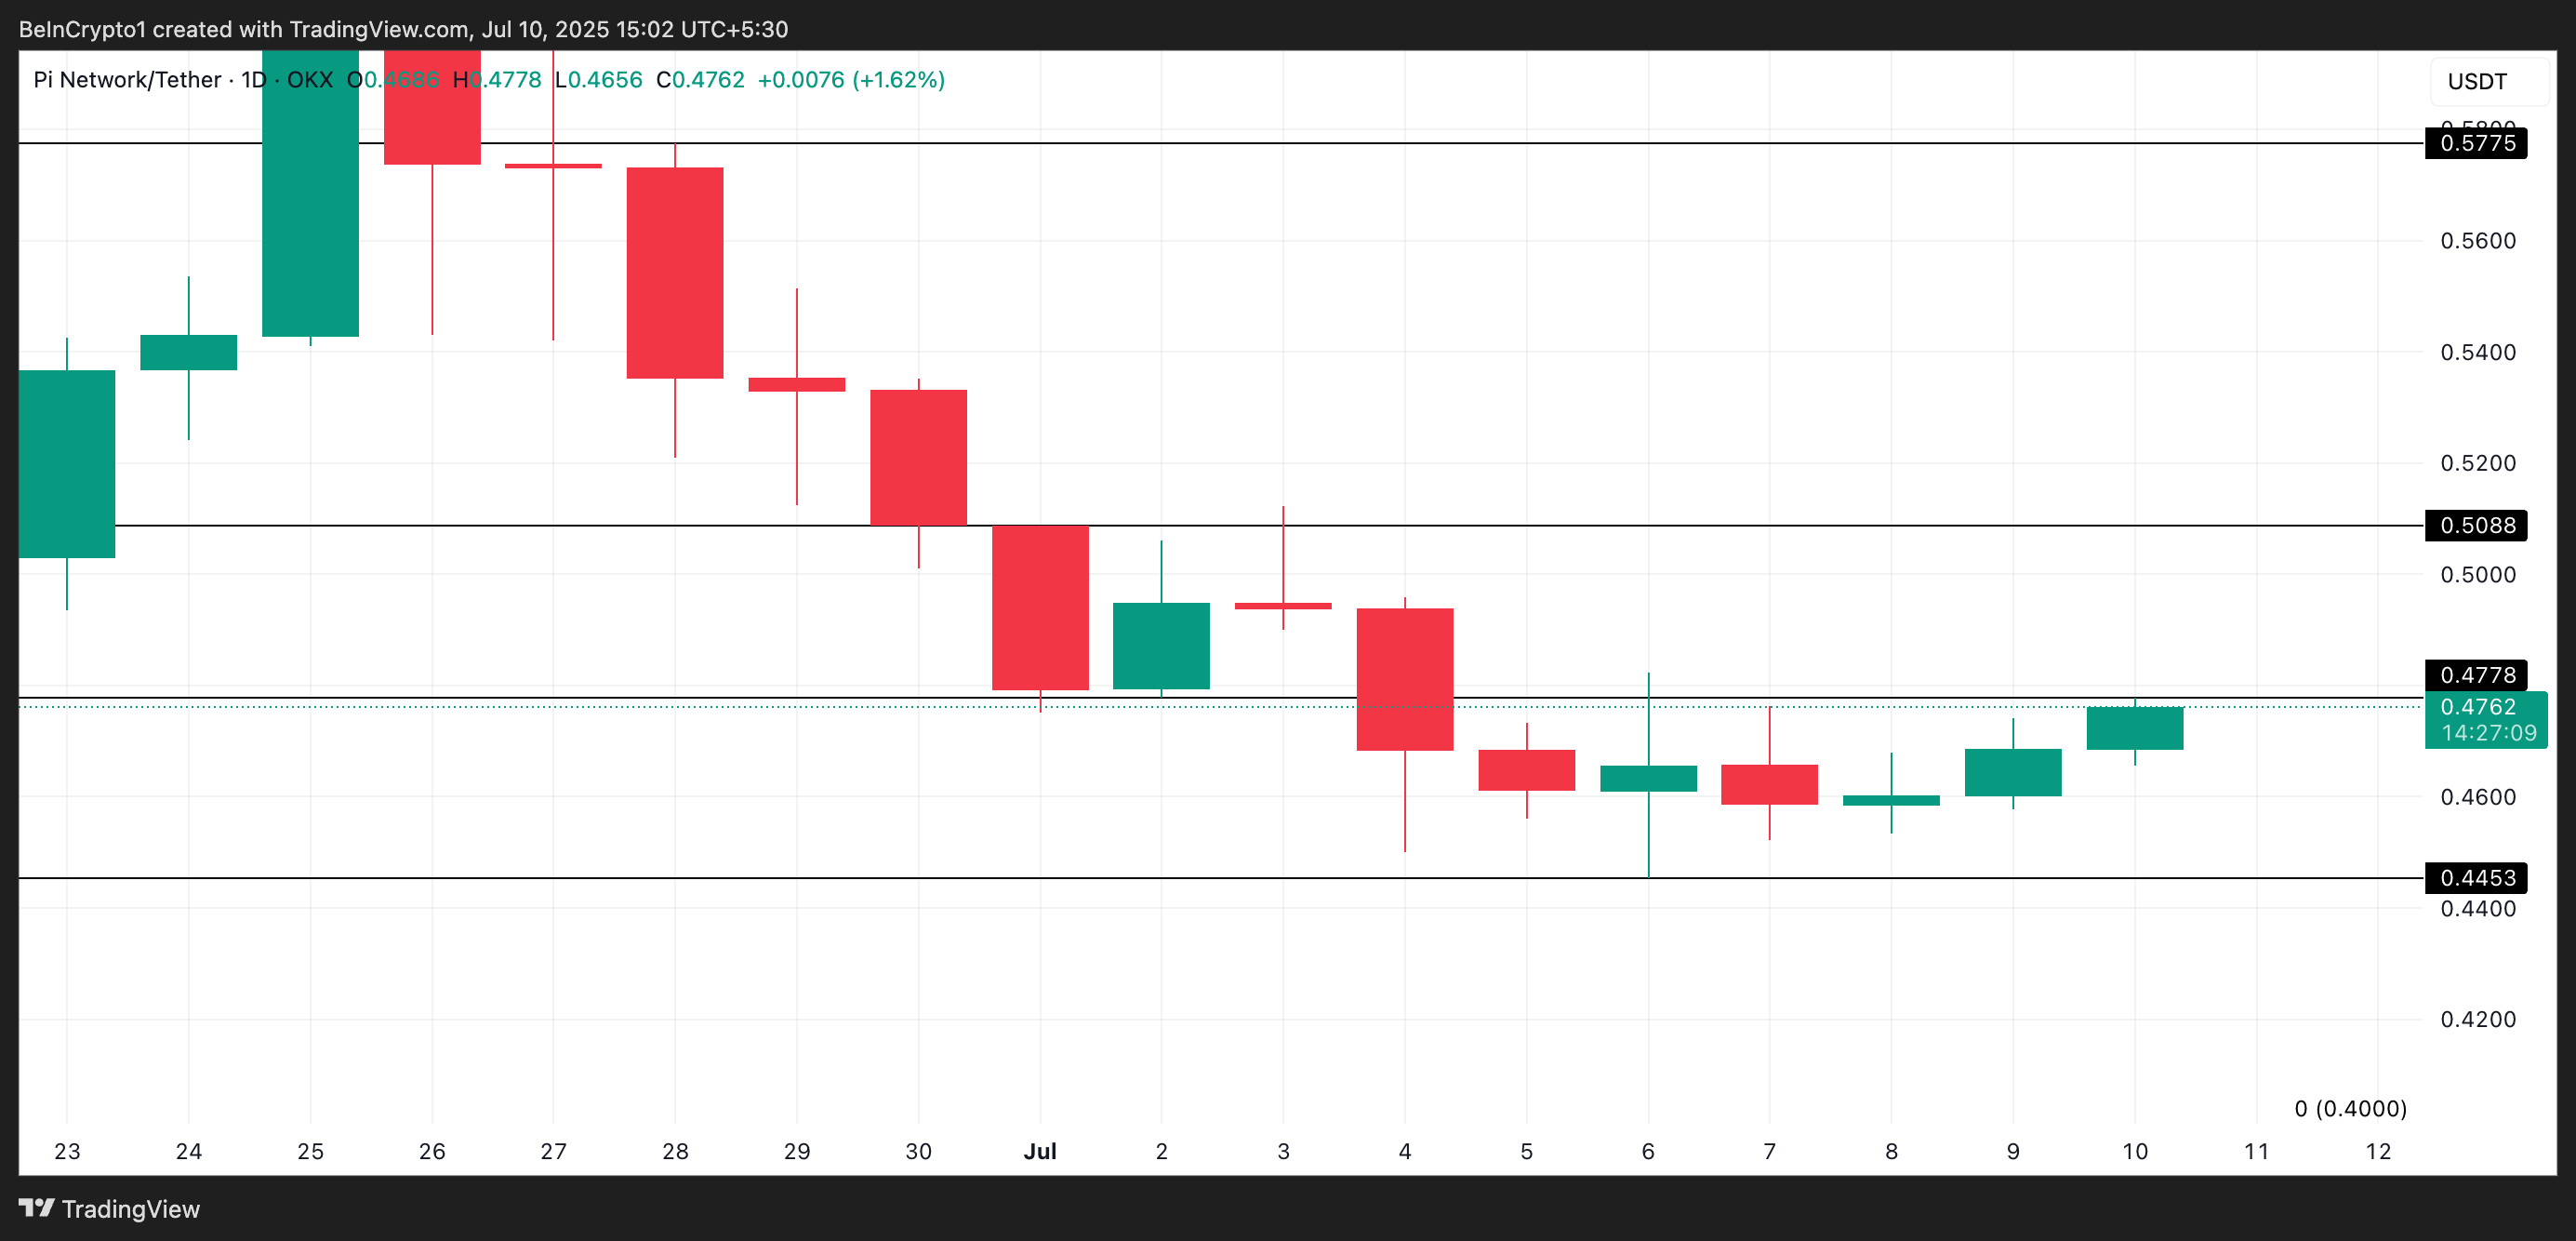 PI Price Analysis. Source: TradingView
Without fresh buying pressure, the current rally could quickly lose steam. In that case, PI risks slipping back into its previous consolidation range—or worse, falling toward the $0.445 support level.
1
0


 Manage all your crypto, NFT and DeFi from one place
Securely connect the portfolio you’re using to start.