Bitcoin price stalls at $115K ahead of Fed decision, altcoins lose momentum as AERO, MNT lead

0
0

After securing key support levels over the weekend, Bitcoin entered a consolidation phase and continued trading sideways near $115,000 throughout the day.
Crypto markets cooled off despite some bullish macro narratives developing in the US, with the total crypto market capitalisation sinking roughly 1% in the past 24 hours, but still above the $4 trillion that was captured last week.
Market sentiment was largely neutral amid the broader market lull, with the crypto fear and greed index dropping by two points to 53, slipping back into neutral territory.
Altcoins mostly followed Bitcoin’s lead, holding onto modest single-digit gains.
Why is Bitcoin price going down?
Despite several macro bullish cues, Bitcoin failed to hold the line above $116,000 and came under pressure as profit-taking picked up across investor classes.
Blockchain data showed selling from both long-term OG holders and newer retail participants, hinting at a broader wave of distribution rather than isolated exits.
On Sunday, an eight-year dormant wallet moved over 1,100 BTC, worth more than $136 million, to Hyperliquid and began unloading.
The address, which had already swapped tens of thousands of BTC for ETH earlier this year, appeared to be reducing Bitcoin exposure further, which spooked traders eyeing the $116,000 level as a psychological battleground.
That wasn’t the only sign of weakness. Glassnode data showed distribution activity across the board, with wallets of all sizes lightening their BTC stacks.
Even as Ethereum whales were quietly scaling their positions, the ETH/BTC ratio on Binance slid for a third straight session, suggesting that dip-buying enthusiasm was more selective than widespread.
In contrast, US equities opened higher on Monday, bolstered by upbeat remarks from President Trump regarding trade negotiations with China and optimism surrounding a potential deal on TikTok.
The Dow added nearly 100 points, and the Nasdaq edged 0.6% higher, pushing both indices closer to record highs.
Gold was also on the move, briefly topping $3,655 and coming within striking distance of its all-time high.
While traditional markets were buoyed by rising expectations of a Federal Reserve rate cut later this week, Bitcoin looked disconnected from the broader risk-on sentiment.
That divergence stood out more sharply as Wall Street’s bet on a 25-basis-point rate cut jumped to 96% following weak labor-market data and hotter-than-expected inflation readings.
Typically, such a backdrop would favor Bitcoin and other risk assets, but the selling pressure from older wallets seemed to override the macro tailwinds, at least for now.
As price hovered near $115,000 into the Wall Street open, traders grew cautious, with many choosing to de-risk ahead of the Fed’s policy announcement on Sept. 17.
With sentiment holding steady in neutral territory and liquidity thinning out near resistance zones, Bitcoin’s next move may depend less on headlines and more on whether bulls can absorb ongoing distribution without losing the $112,000–$114,000 range.
For crypto trader and analyst Michaël van de Poppe, this was expected.
Calling it “very classic price action prior to the FOMC meeting,” van de Poppe noted on X that it’s common for both Bitcoin and altcoins to correct in the days leading up to US central bank announcements.
He added that the weakness is “very likely” to persist until after the meeting has passed.
Can Bitcoin price go up again?
With the current macro backdrop, most market watchers, like van de Poppe, were expecting the OG cryptocurrency to resume its upward rally once selling pressure subsides.
According to several prominent analysts, Bitcoin has confirmed a hidden bullish divergence on the weekly timeframe, a pattern that historically precedes a continuation of the prevailing trend.
On the price chart, this shows up as higher lows in price action while the RSI forms lower lows, a setup that often signals underlying strength despite short-term weakness.
“Bitcoin weekly hidden bullish divergence is now confirmed,” trader BitBull said in a recent X post, noting that since 2023, every bullish or hidden bullish divergence on Bitcoin has eventually played out with strong upside follow-through.
That sentiment was echoed by fellow trader Merlijn, who described the divergence as a sign the macro picture is “screaming continuation.”

BTC/USDT 1-week chart. Source: Merlijin The Trader.
In his view, BTC’s upside looks “inevitable,” especially if BTC manages to hold current support levels through the upcoming FOMC decision.
When looking at the 24-hour liquidation heatmap, those support areas are located between $113,000 and $114,000, where we see significant clusters of liquidation leverage and high interest from buyers stepping in.

Bitcoin – 24 hour liquidation heatmap. Source: Coinglass.
The band just above $114K has been absorbing downward pressure throughout the day, offering a temporary floor even as broader risk sentiment and on-chain activity remain cautious.
Earlier in the session, Bitcoin made an attempt to reclaim territory near $116,600, but was sharply rejected.
The rejection coincided with a dense liquidation zone on the heatmap, suggesting a flush-out of over-leveraged long positions around that price.
Once the $116K wall gave way, sell-side momentum accelerated, triggering a cascade of liquidations that dragged the price back toward the current range near $115K.
The heatmap now shows lighter liquidation pressure directly above, indicating a potential short-term vacuum in resistance up to around $117,000.
However, without fresh bullish catalysts or stronger spot demand, that zone could remain a ceiling heading into the FOMC meeting.
At the same time, the lower boundary around $113,000 appears heavily defended.
Multiple liquidation bands suggest strong buying interest around that level, which aligns with the broader weekly support zone that traders like BitBull and Merlijn have highlighted.
If Bitcoin can maintain that floor, especially in the face of ongoing distribution and pre-FOMC volatility, the case for a bullish continuation into late September remains intact.
Meanwhile, market analyst Daan Crypto Trades noted that BTC is likely to continue trading within a tight range. See below:
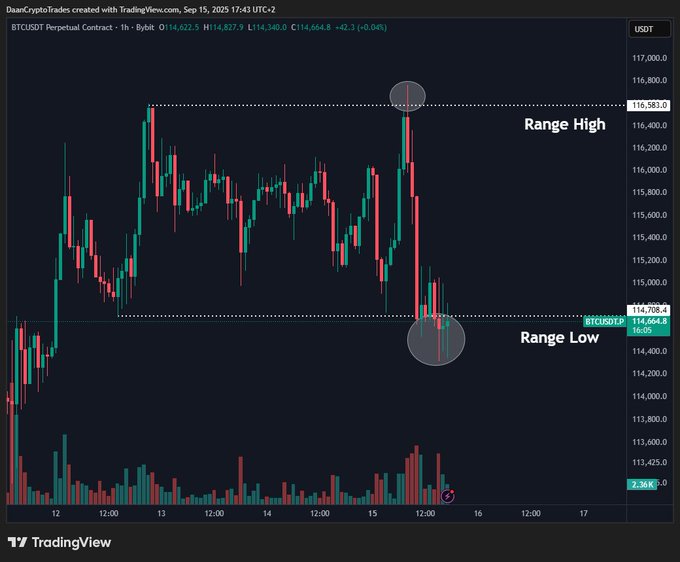
At the time of writing, Bitcoin was trading at $114,794, showing little to no change over the past 24 hours.
Altcoin prices remain subdued
In the past 24 hours, the altcoin market cap initially rose to an intraday high of $1.86 trillion before ending the day 1.1% lower at $1.79 trillion.
Despite the drop, some analysts see the onset of an altcoin season soon now that the Altcoin Season Index shows a reading of 71, just shy of the 75 level that officially signals the beginning of a true altseason.
Others have issued warnings, noting that the current market dynamics resemble those that preceded the major correction in early 2025, when the altcoin market faced a sharp decline after showing similar signs of a rally as seen this month.
The leading altcoin by market cap, Ethereum (ETH), was down 2.4% at press time as it traded a little below the $4,500 level.
Other large-cap altcoins like XRP (XRP), Solana (SOL), Dogecoin (DOGE), and Tron (TRX) recorded losses ranging between1-5%.
Meanwhile, among the top 100 altcoins, Aerodrom Finance (AERO) and Mantle (MNT) stood out, posting better-than-average gains of 8.6% and nearly 7%, respectively.
World Liberty Financial (WLFI) also followed with a daily gain of 3.3%.

Source: CoinMarketCap
The post Bitcoin price stalls at $115K ahead of Fed decision, altcoins lose momentum as AERO, MNT lead appeared first on Invezz
0
0


 Manage all your crypto, NFT and DeFi from one place
Securely connect the portfolio you’re using to start.


