How do US exchanges contribute to Bitcoin’s market liquidity?

0
0

In financial markets, liquidity refers to the ease with which an asset can be bought or sold without affecting its price significantly. The higher the liquidity, the more stable the market is, as many transactions can happen smoothly and with minimal slippage.
Bitcoin’s struggle to stay above $52,000 this week has reignited discussions about the market’s liquidity. With on-chain data suggesting a potential supply crunch, insufficient liquidity could be the spark that ignites significant volatility in the market.
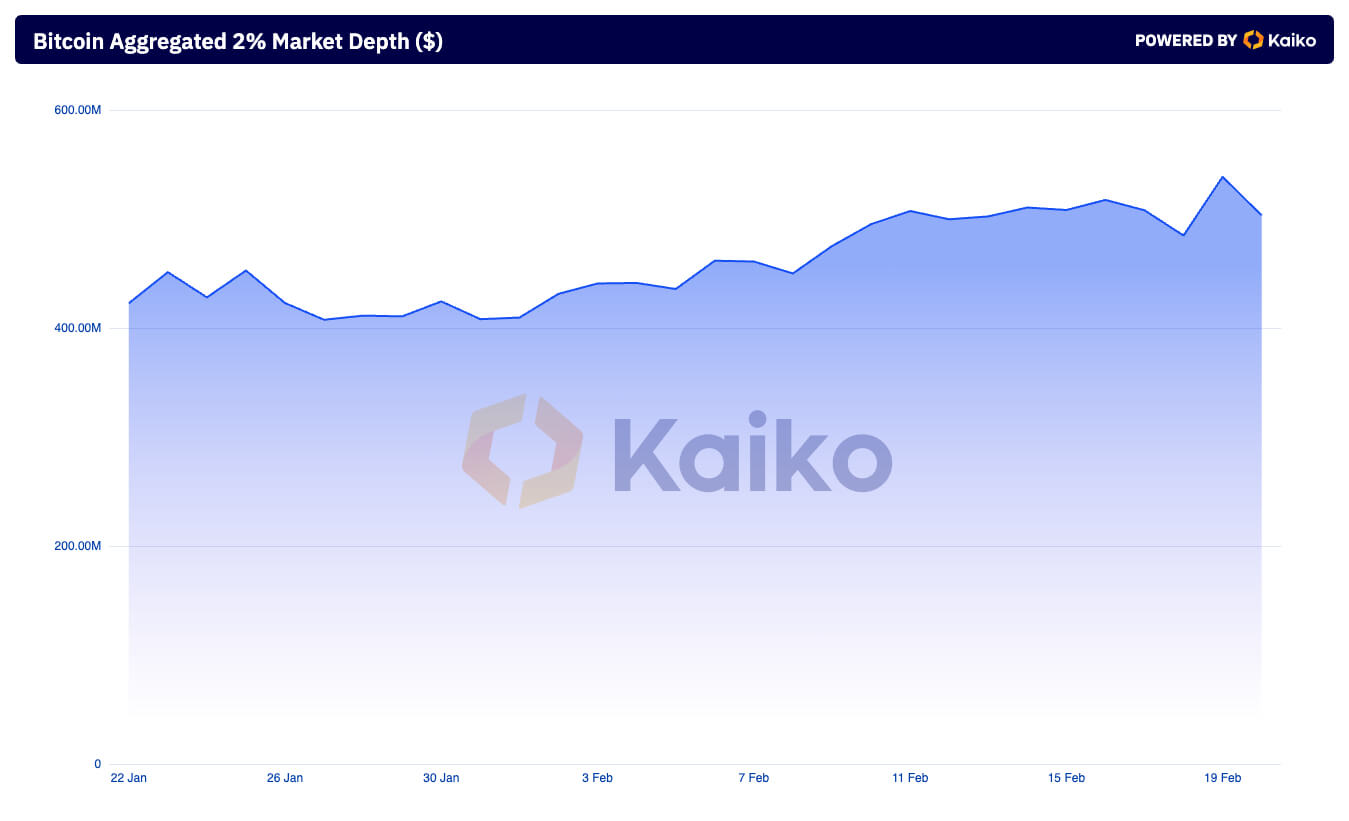
To determine just how liquid the Bitcoin market is and where that liquidity lies, CryptoSlate analyzed data from Kaiko. Kaiko’s aggregated 2% market depth is a significant metric for determining liquidity and potential price stability around the current price level.
A 2% range is commonly used as a benchmark for assessing liquidity because it balances between too narrow and too broad a measure. A 2% price range is a compromise that acknowledges this volatility while still providing a snapshot of market depth. It’s tight enough to be relevant in fast-moving markets but wide enough to capture a meaningful array of buy and sell orders.
There has been a significant rise in market liquidity this week, with the aggregated 2% market depth increasing from $485.05 million on Feb. 18 to $538.92 million on Feb. 19. This increase shows that more buy and sell orders were placed within 2% of the market price, suggesting more traders are ready to execute trades near the current price. The subsequent drop to $503.45 million on Feb. 20 still represents an overall increase from February levels but suggests a slight cooling off from the previous day’s activity.
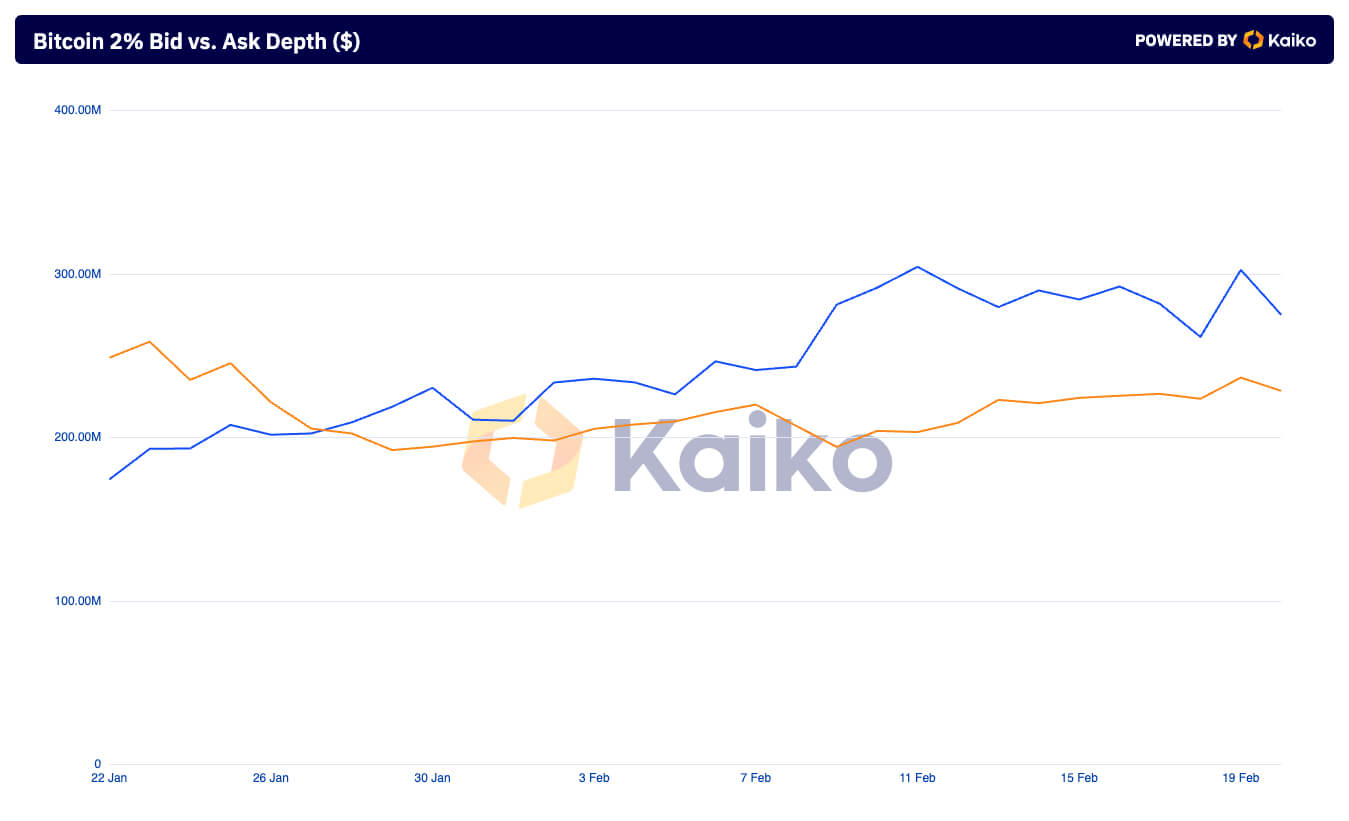
Kaiko’s bid vs. ask depth metric provides further insight into market sentiment. On Feb. 18, the ask (sell orders) depth was greater than the bid (buy orders) depth, with $261.42 million in asks versus $223.63 million in bids. This disparity widened on Feb. 19, with asks growing to $302.41 million against bids of $236.54 million. The increased ask depth relative to bid depth shows sellers were more active or aggressive in placing orders close to the market price, possibly expecting higher future prices or looking to capitalize on current prices.
The distribution of market depth between the US and global markets shows 51.84% of the depth coming from the global market. This distribution implies that over half of the liquidity within 2% of the market price is being contributed by global markets outside the US.
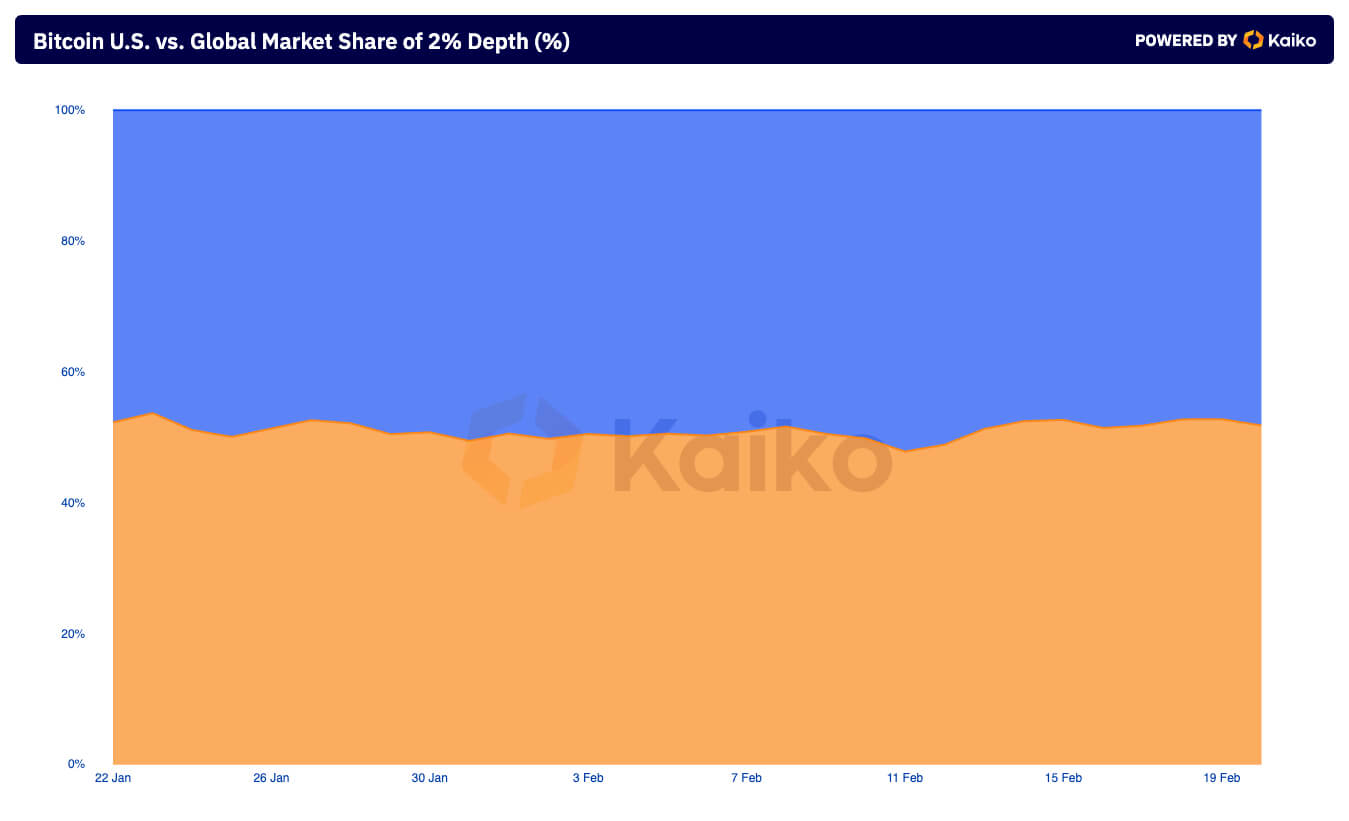
The distinction between the proportion of trade volume and liquidity attributed to US exchanges compared to global exchanges helps us see the relative influence of that liquidity. According to Kaiko, US centralized exchanges comprise 13.66% of the global Bitcoin trading volume.
The fact that US exchanges account for a significant share of global liquidity (49%) yet contribute a relatively small portion to global trade volume (13.66%) suggests that they are highly liquid. This liquidity implies that US markets can handle large trades efficiently, with minimal price impact. However, the lower volume share indicates that fewer transactions are responsible for this liquidity, possibly reflecting larger average transaction sizes or a concentration of institutional participants.
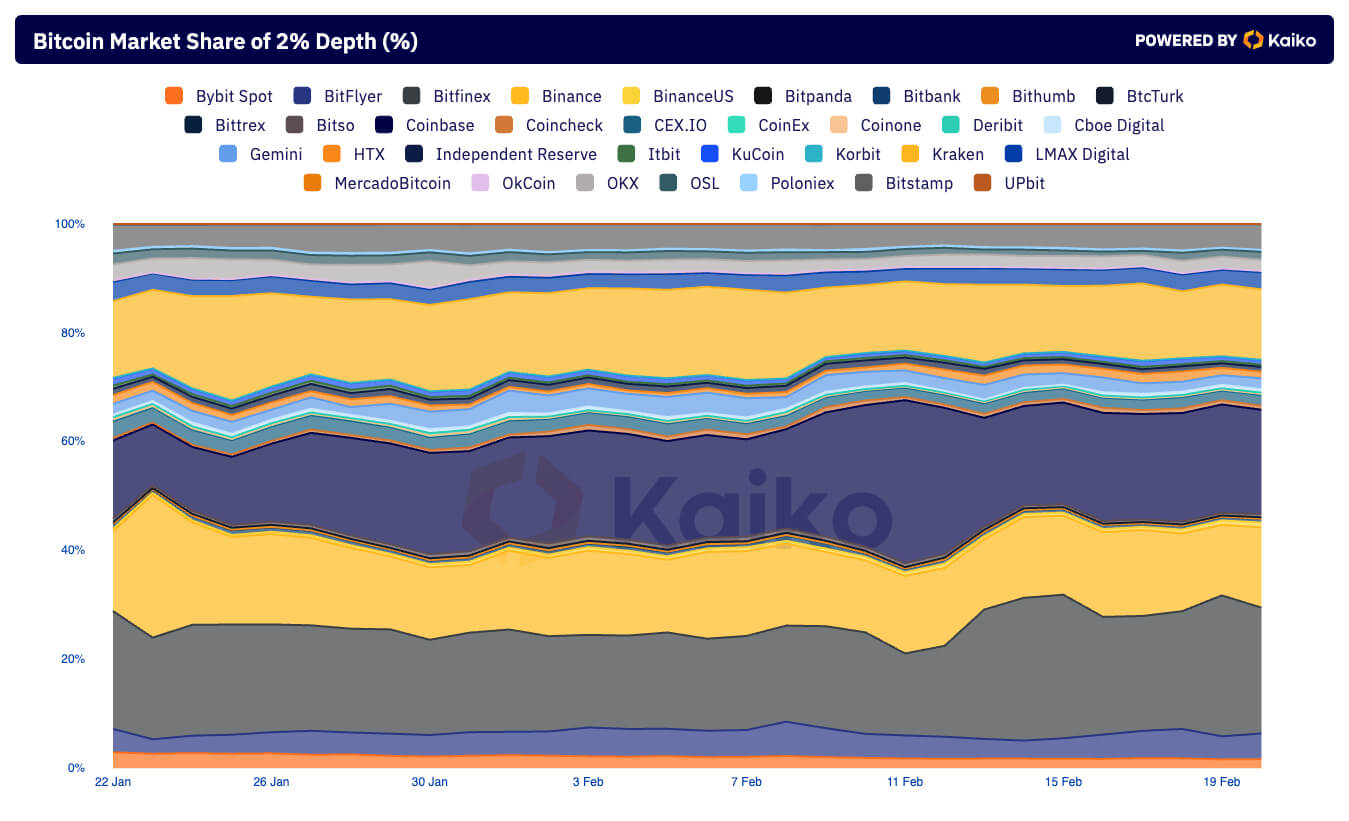
This hypothesis is further confirmed by looking at the exchanges’ market share of 2% depth. Bitfinex accounts for the largest share, with 23.12%. Coinbase comes second with a 19.18% share, while Binance ranks 3rd with a 14.75% share and Kraken 4th with a 12.96% share.
Coinbase’s position particularly reinforces the role US exchanges have in global liquidity. Given Coinbase’s status as a regulated exchange within the US and a significant player in the spot Bitcoin ETF market, its substantial contribution to liquidity indicates the US market’s capacity to offer deep and stable trading environments, likely attracting many institutional and sophisticated investors.
The presence of both U.S.-based exchanges (Coinbase and Kraken) and international platforms (Bitfinex and Binance) among the top contributors to 2% depth liquidity aligns with the previous analysis. It demonstrates the critical role the US plays in providing liquidity through regulated exchanges while highlighting the global market’s share in trading activity and liquidity provision.
The post How do US exchanges contribute to Bitcoin’s market liquidity? appeared first on CryptoSlate.
0
0

 Manage all your crypto, NFT and DeFi from one place
Securely connect the portfolio you’re using to start.


0
0

