Daily Market Review: BTC, ETH, FET, STX, HEX

1
0

Bulls have regained control of markets as seen from the rising global market cap, which has seen a 0.57% jump in the last 24 hours to hold a spot price of $1.97T as of press time. The trading volume has. However, dropped by 5% to $83.8 within the same period.
Bitcoin Price Review
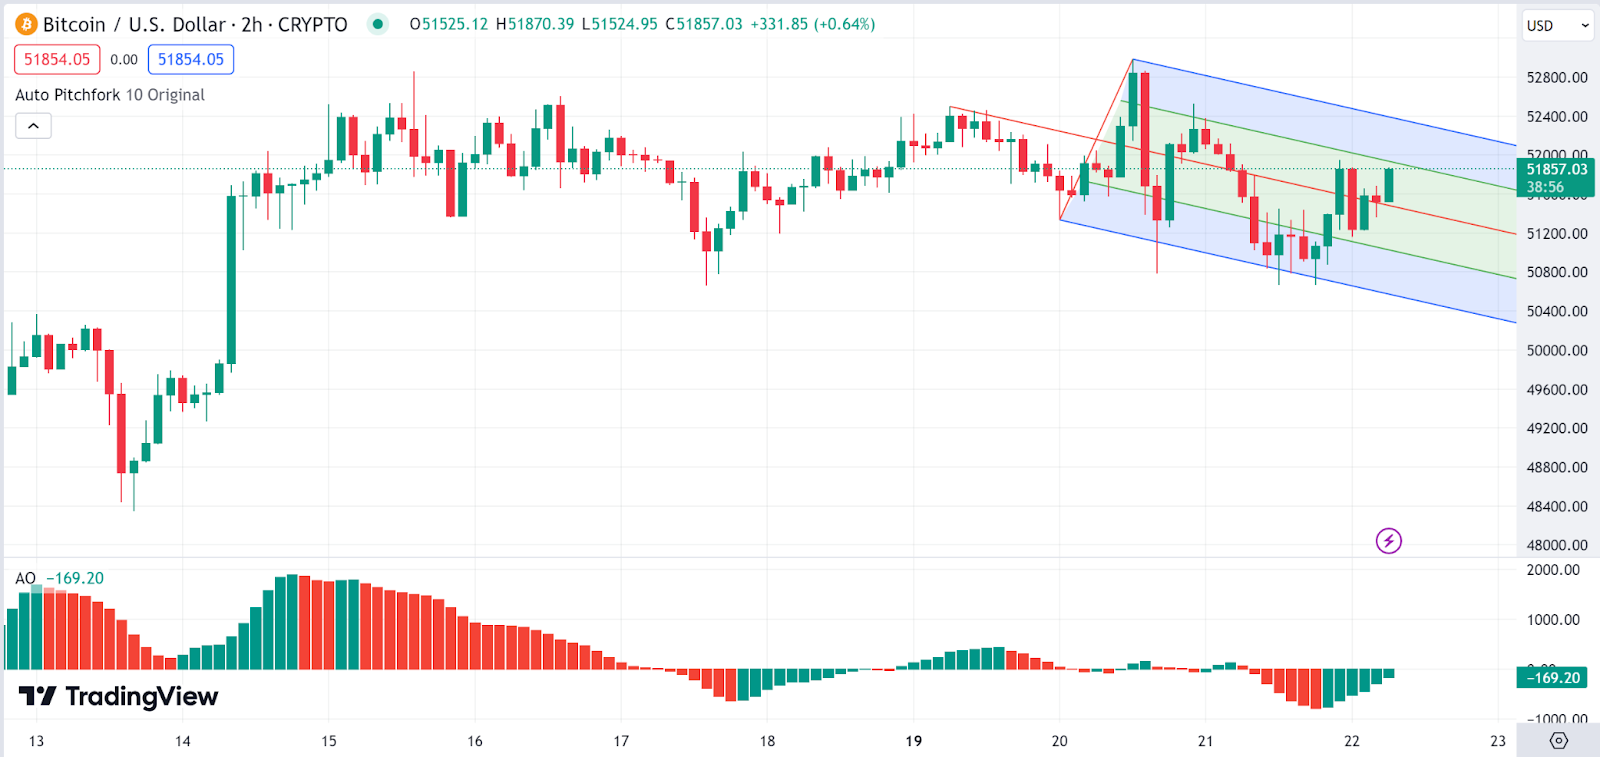
The Bitcoin (BTC) chart shows a 2-hour time frame with an Auto Pitchfork and Awesome Oscillator (AO) indicator. The Bitcoin price is within the middle half of the pitchfork, suggesting that it is in a normal range without showing strong bullish or bearish momentum. Traders might watch for a breakout above the upper half or a breakdown below the lower half for potential trading signals.
On the flip side, the Awesome Oscillator is transitioning from red to green histograms below the zero line, which could indicate a potential shift in momentum from bearish to less bearish or neutral. However, since it’s below zero, the overall momentum is still considered bearish in the larger context. The *BTC* stood at $51.8K as of press time, representing a 0.19% increase in the last 24 hours.
Ethereum Price Review
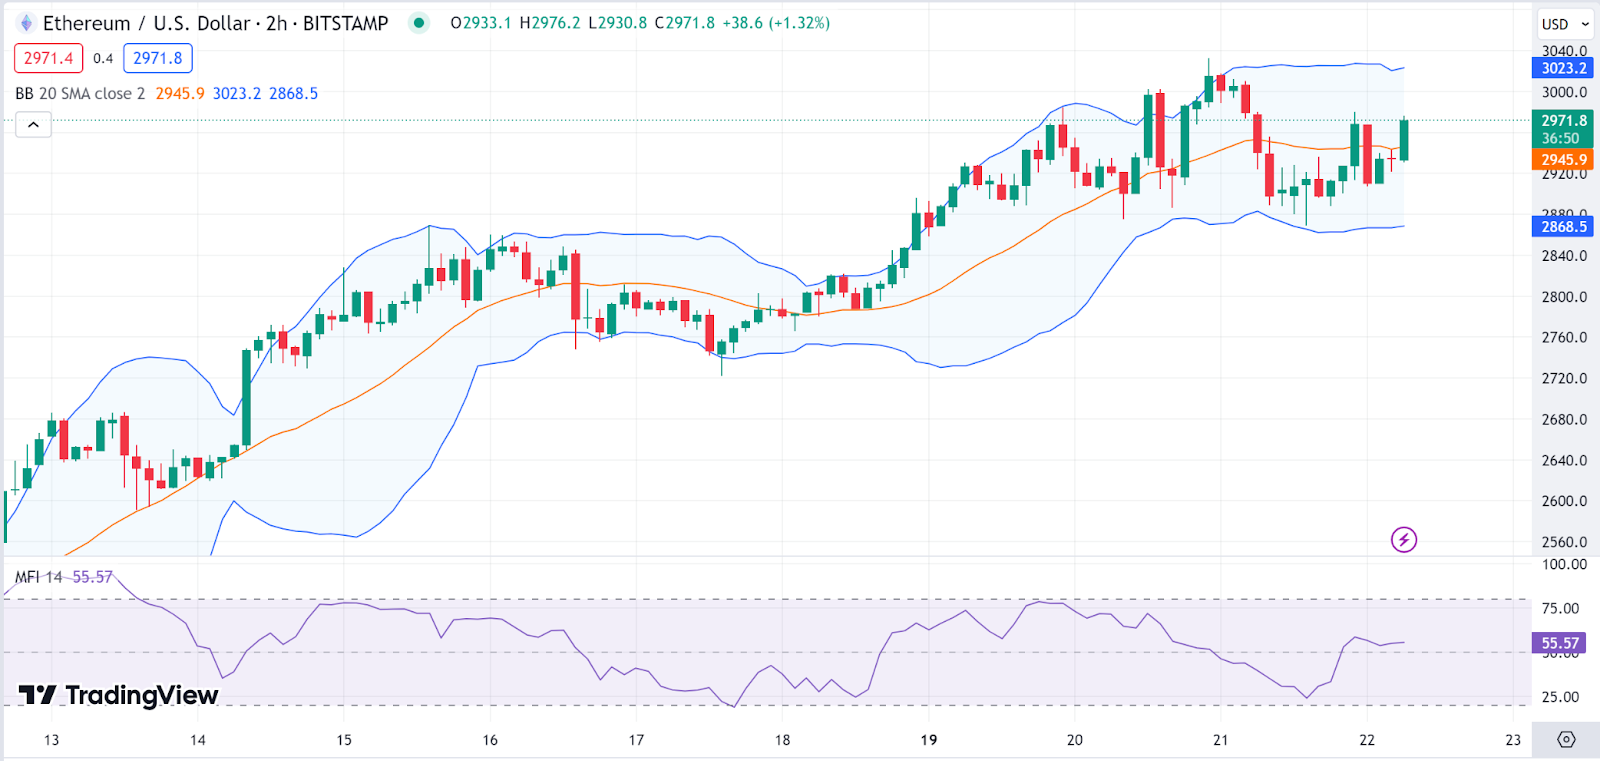
This Ethereum (ETH) chart displays a 2-hour time frame with Bollinger Bands and Money Flow Index (MFI). The Ethereum price is currently near the upper Bollinger Band, indicating that ETH is in a higher volatility zone and potentially overbought. Traders might anticipate a reversion towards the mean (the middle band).
The Money Flow Index (MFI) is moderately high at 55.57, which is not in the overbought territory (>80) but suggests that there is significant buying pressure. Traders might watch for any signs of divergence with the Ethereum price for potential reversal signals. The *ETH* stood at $2983 as of press time, representing a 1.6% increase in the last 24 hours.
Fetch.AI Price Review
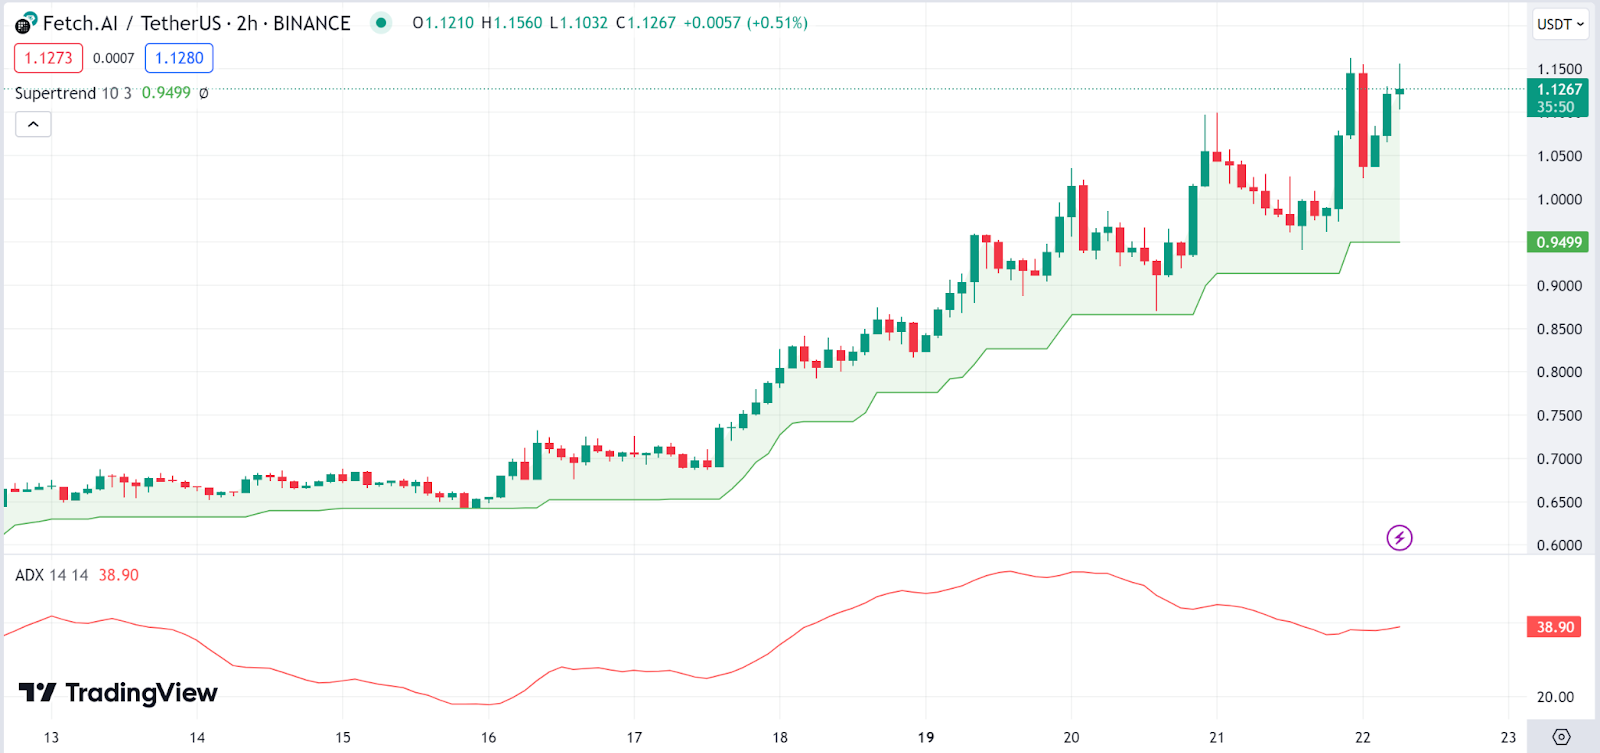
This chart of Fetch.AI (FET) against Tether US shows a 2-hour time frame with a Supertrend indicator and Average Directional Index (ADX). The Supertrend indicator is green and below the Fetch.AI price, suggesting a bullish trend. As long as the Fetch.AI price remains above the Supertrend line, the uptrend might continue.
Additionally, the Average Directional Index (ADX)**: The ADX value is high at 38.90, indicating a strong trend. Given the green Supertrend, this strength is associated with the uptrend. The Fetch.AI price stood at $1.14 as of press time, representing a 12.6% increase in the last 24 hours.
Stacks Price Review
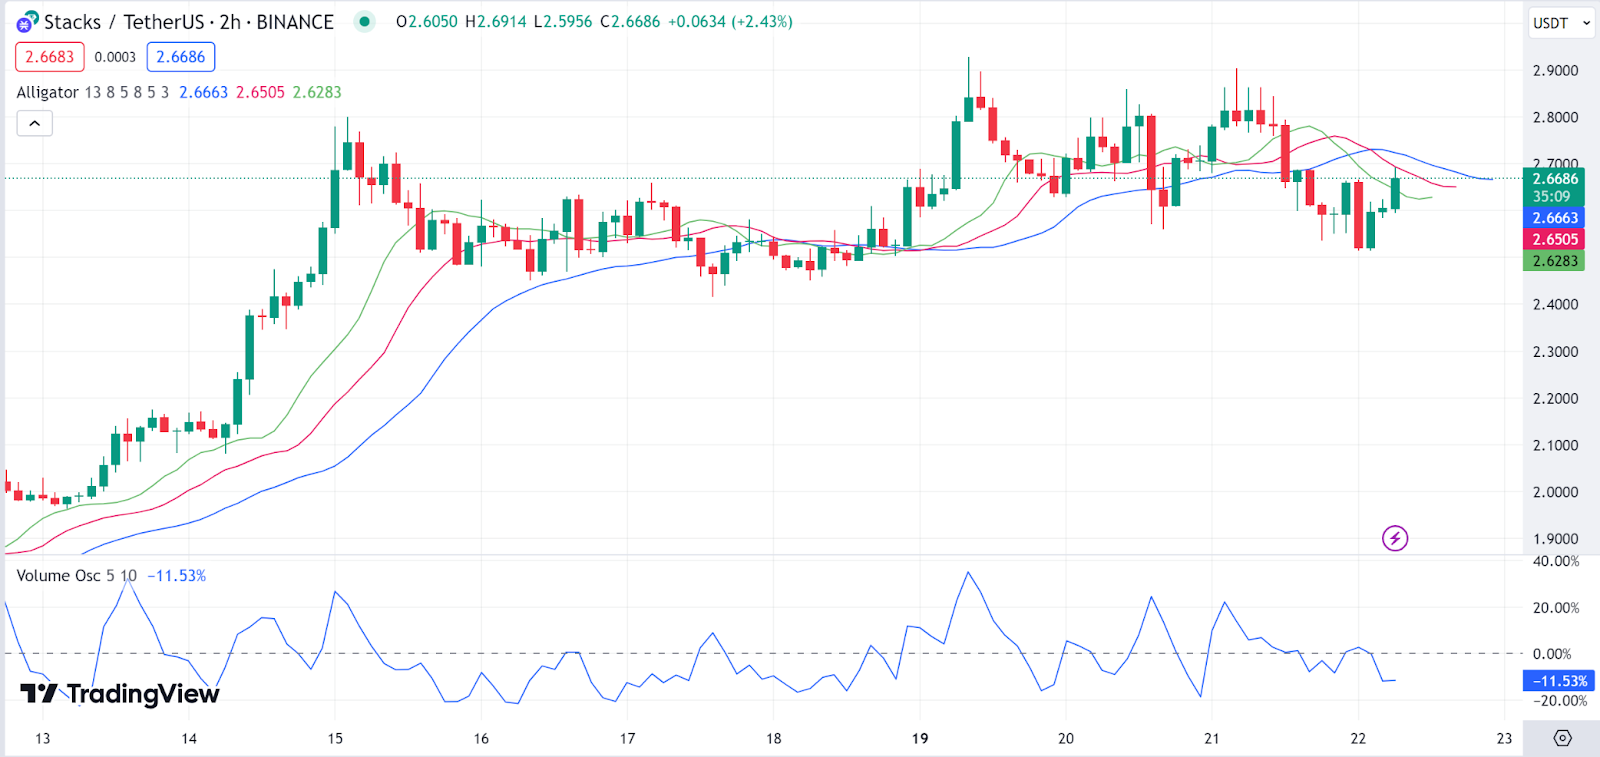
The Stacks (STX) chart is set to a 2-hour time frame and includes the Alligator indicator and Volume Oscillator. The Stacks price is interweaving with the Alligator’s jaws, indicating a lack of a clear trend and potential sideways movement. Watch for the price to align with the Alligator’s lines for a trend indication.
In addition to this, the Volume Oscillator is negative, suggesting volume is decreasing on upward the Stacks price movements. This could indicate a lack of bullish conviction. The Stacks price stood at $2.7 as of press time, representing a 4.6% decrease in the last 24 hours as the token now faces corrections.
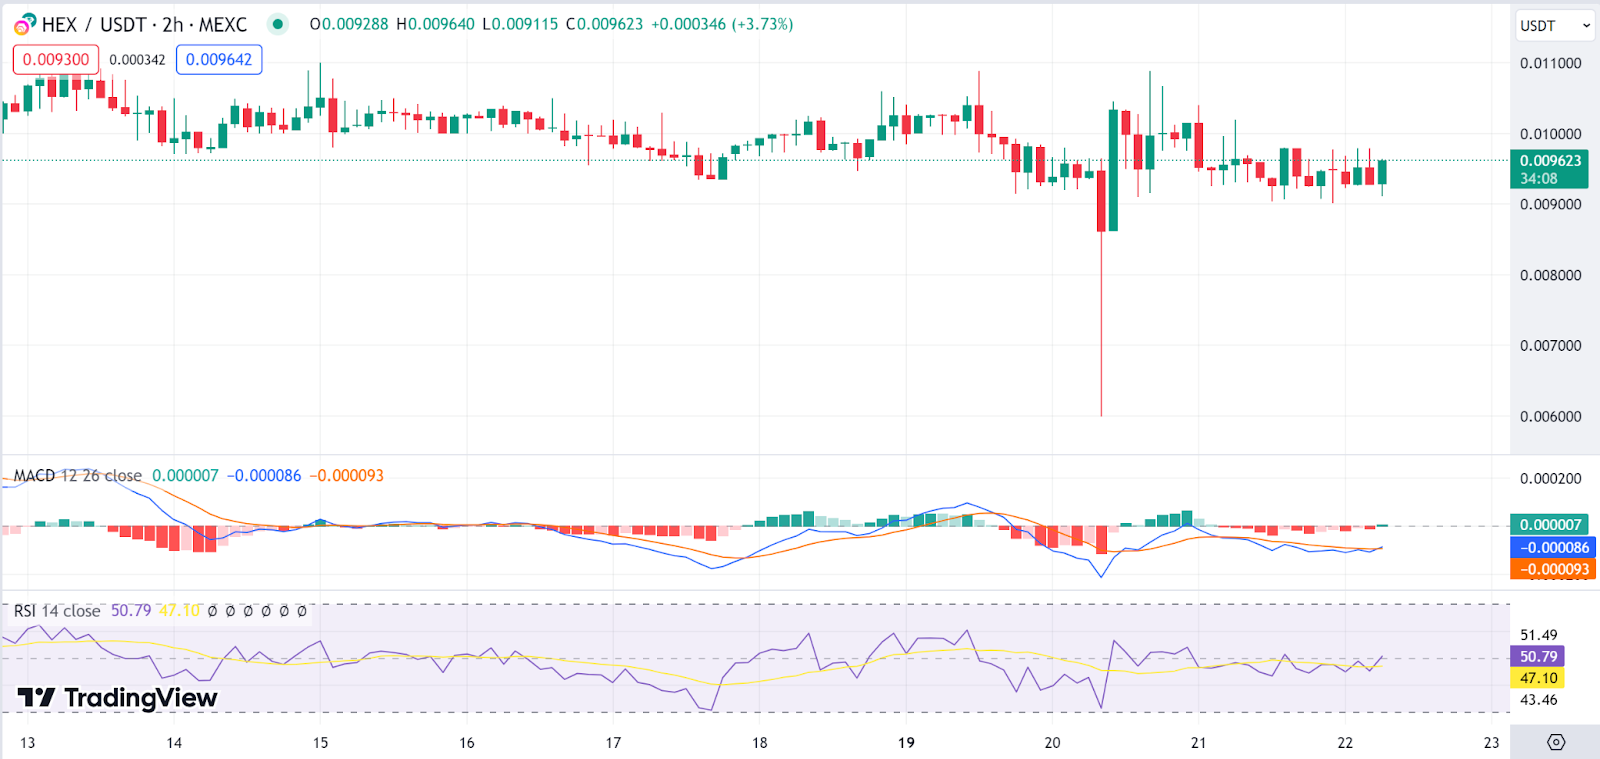
HEX Price Review
For the HEX price chart, the time frame is 2 hours with MACD and Relative Strength Index (RSI) indicators. The Moving Average Convergence Divergence (MACD) line is very close to the signal line and hovers around zero, suggesting there’s no strong momentum and the market is in consolidation.
On the other hand, the Relative Strength Index (RSI) is around 50, indicating neither overbought nor oversold conditions. This further suggests a neutral market without strong bullish or bearish momentum on the HEX price. The HEX price stood at $0.00936 as of press time, representing a 0.5% decrease in the last 24 hours as the token also faced minor corrections.
1
0
 Manage all your crypto, NFT and DeFi from one place
Securely connect the portfolio you’re using to start.


0
0
