
Threshold Price Prediction: Can $T Reclaim Key Resistance?

0
0

$T is trading near $0.004577, up 26.35% in the last 24 hours, as of 14:30 UTC on September 2, 2026. The move looks like a genuine trend shift, not noise. Immediate support sits at $0.003210, and the token just tested the $0.007800 resistance zone. This Threshold price prediction hinges on one thing: a confirmed close above that zone could open the door toward $0.010. Lose the support, though, and the recovery story falls apart fast.
Quick Prediction Box
Metric | Value |
Current Price | $0.004577 |
24H Change | +26.35% |
Trend | Bullish (short-term) |
Next Target | $0.007800 |
Support | $0.003210 |
Resistance | $0.007800 |
RSI (Daily) | 73.17 |
Bull Case | $0.010 – $0.017 |
Base Case | $0.005 – $0.007 |
Bear Case | $0.003 |
Invalidation | Below $0.003147 |
Threshold Price Prediction: Current Market Outlook
At $0.004577, T carries a market cap near $51 million. Turns out, volume is doing the heavy lifting here.
24-hour volume printed $55.32 million, above the entire market cap. That's unusual. Weekly trades show a sharp reversal after months of grinding lower, worth tracking through a detailed price prediction analysis.
Bitcoin is trading softer today, down over 1%. But T is moving independently, for now.
Threshold Technical Analysis: Key Levels to Watch
T Support Levels
Immediate support holds at $0.003210. Below that sits the recent low of $0.003147, near the all-time low.
If trades slip under $0.003147, the bullish structure breaks. Simple as that. The T price chart shows price hugging this zone for weeks.
$T Resistance Levels
The first wall is $0.007800. Above it, $0.010207 is next. A break of both confirms the daily descending triangle breakout is real, not a fakeout.
The weekly chart flags $0.017580 as heavier resistance. And $0.043070 sits far above, needing sustained demand through new exchange listings to even approach.
$T Daily Chart Analysis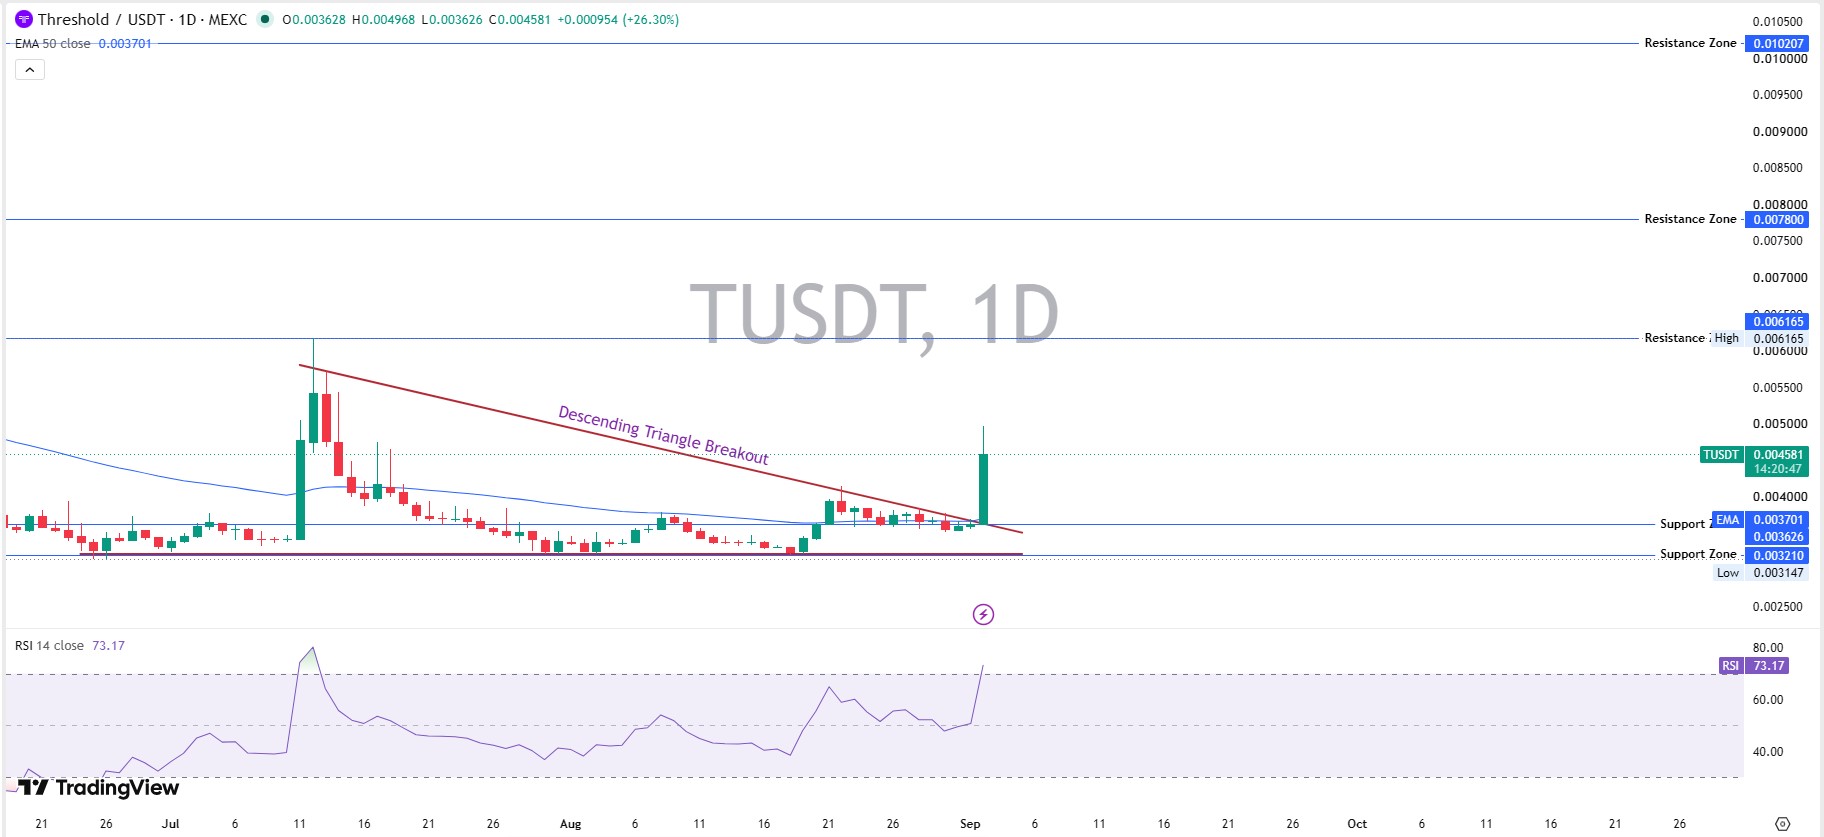
The 1-day trades opened at $0.003628 and closed near $0.004581, a 26.30% gain. That candle broke clean through a descending triangle, a pattern where price squeezes between falling highs and flat lows until it snaps.
RSI 14 sits at 73.17, overbought. Doesn't guarantee a reversal, but the move is stretched. EMA 50 trades far below at $0.003701.
Threshold Weekly Chart Analysis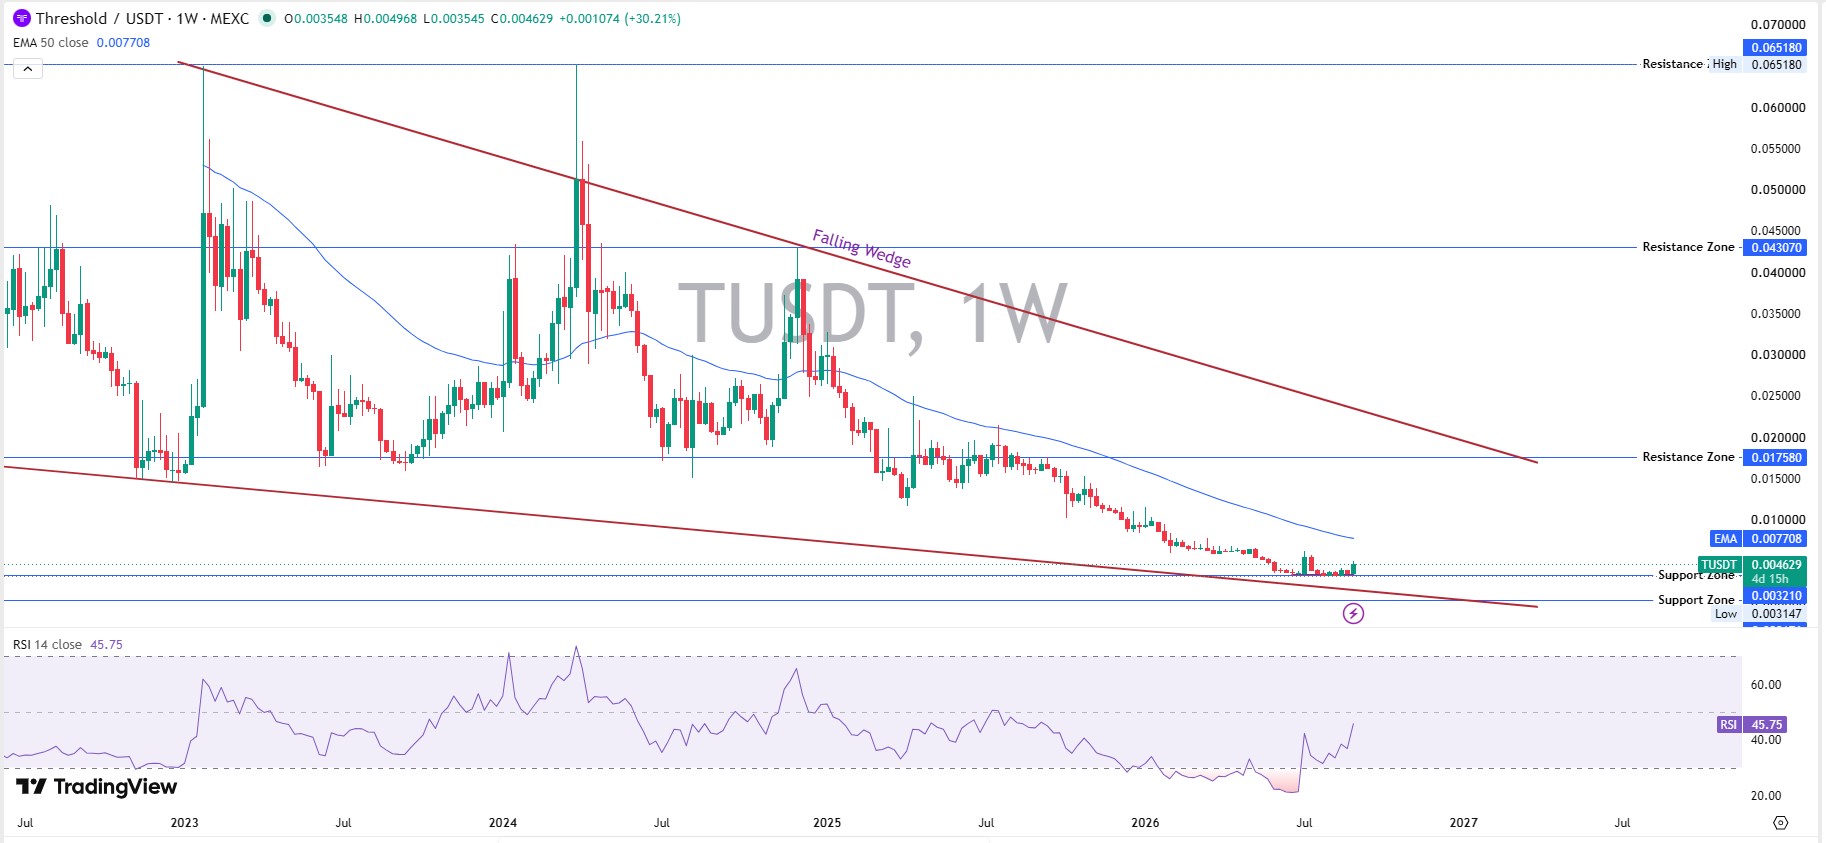
Zoom out, and the picture changes. $T has carved a falling wedge since early 2023, a pattern where highs and lows compress downward together.
This week's trades opened at $0.003548 and closed at $0.004629, up 30.21%. Weekly RSI reads 45.75, still neutral. Daily momentum looks hot; weekly barely woke up. EMA 50 sits at $0.007708, near the next resistance test.
$T Price Prediction: Bull, Base and Bear Scenarios
Bullish Scenario
For the bull case, trades need to hold above $0.007800 with volume confirming. RSI staying above 60, plus a break of $0.010207, opens Target 1 near $0.013. Target 2 sits around $0.017580.
This needs momentum, not hope. Bitcoin market trend data matters too.
Base Scenario
The base case is simpler: $T consolidates between $0.005 and $0.007. Expect choppy trades, not a straight line.
Floor: $0.003210. Ceiling: $0.007800. Tracking the upcoming crypto events calendar can flag catalysts early.
Bearish Scenario
If $0.003210 fails, the bear case targets $0.003147, then a retest near $0.003163. That invalidates the bullish thesis.
Worth asking: does a 26% pump on thin liquidity actually hold?
$T Price Prediction 2026
Minimum: $0.0032, if support breaks.
Base: $0.006 to $0.009, range-bound into year-end.
Maximum: $0.017, if the weekly wedge resolves upward with strong Bitcoin conditions and renewed broader altcoin news flow.
Threshold Price Prediction 2027
By 2027, it depends on market-cycle timing.
Bear: $0.004.
Base: $0.015.
Bull: $0.043,
matching current resistance if adoption accelerates.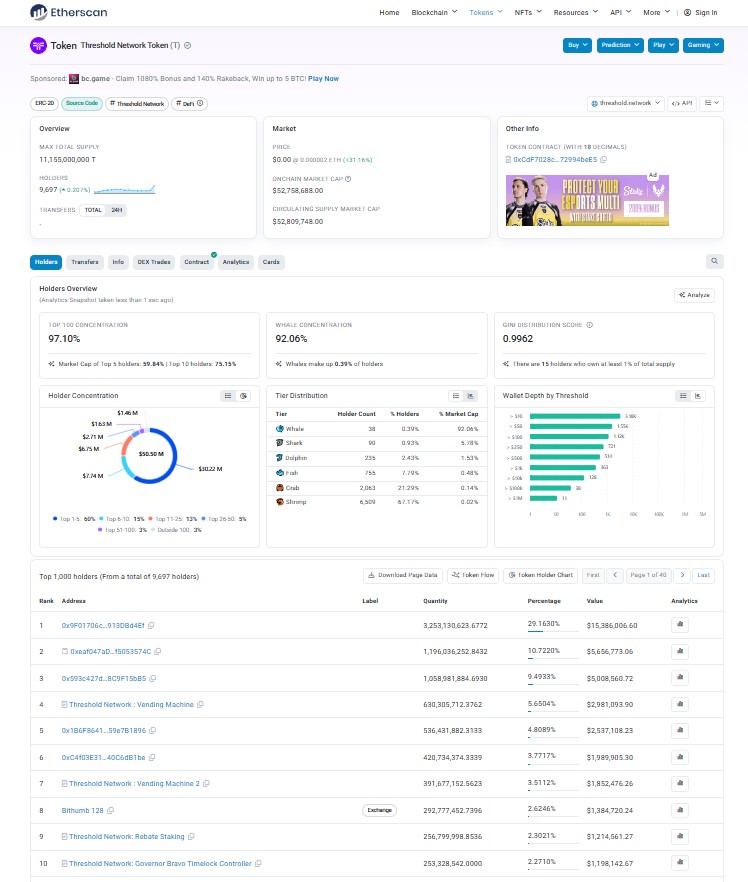
Supply matters too. On-chain holder distribution shows the top ten wallets control over 75% of supply, a real risk to any rally.
Threshold Price Prediction 2030
We won't pretend to know one number this far out.
Bear: $0.003.
Base: $0.02.
Bull: $0.065,
retesting the 2024 high on a full market-cycle recovery.
What Could Drive T Higher?
Threshold Network Developments
The push into institutional Bitcoin custody, detailed in a recent Threshold Network announcement, gives $T a narrative beyond speculation.
DeFi and Bitcoin Ecosystem Growth
tBTC integrations with lending venues add utility. More usage means more demand for $T, not just emissions.
Market-Wide Altcoin Momentum
Risk-on conditions across latest AI sector news tend to lift smaller-cap tokens alongside majors.
Exchange and Liquidity Catalysts
Binance alone processed over $47 million in 24-hour volume for $T, confirmed through liquidation heatmap data.
What Could Push T Lower?
Bitcoin weakness is the biggest risk. And whale concentration, 92% of supply in large wallets, means one exit can crush price.
A break below $0.003147 confirms bearish continuation.
T vs Bitcoin: Which Trend Is Stronger?
Bitcoin is down about 1% today while T is up over 26%. That's a massive divergence.
T/BTC is clearly outperforming right now. But short bursts don't always last, especially against a backdrop of memecoin market news showing similar spikes. Bitcoin's price trend still sets the tone market-wide.
Threshold Price Prediction: What Traders Should Watch Next
Above $0.007800, expect bullish continuation, per live market cap and volume data. Between $0.003210 and $0.007800, consolidation is the likely path.
Below $0.003147, the bearish invalidation is confirmed. Watching the crypto events calendar and active crypto airdrops could shift this range sooner than the charts suggest.
The levels are set. What happens next isn't.
Disclaimer
Not financial advice. Threshold (T) and crypto markets are highly volatile. Levels here can change fast. Do your own research.
0
0

 Manage all your crypto, NFT and DeFi from one place
Securely connect the portfolio you’re using to start.