These 3 Cryptos Could Drop to New Lows in December

1
1

November was a decisively bullish month for the cryptocurrency market, but these three bearish cryptos face a negative outlook for December.
Even though the Bitcoin (BTC) price and several altcoins reached new yearly highs, the worst is yet to come for these three cryptos.
Celestia (TIA) Falls After All-Time High
The TIA price began a massive upward movement on November 10, increasing by 200% in the next eight days. The upward movement culminated with a new all-time high price of $7.42 on November 18. However, the altcoin has fallen since.
The fall was preceded by a bearish divergence in the six-hour Relative Strength Index (RSI) (green).
With the RSI as a momentum indicator, traders can determine whether a market is overbought or oversold and decide whether to accumulate or sell an asset.
Bulls have an advantage if the RSI reading is above 50 and the trend is upward, but if the reading is below 50, the opposite is true.
A bearish divergence occurs when a momentum decrease accompanies a price increase. It often preceded bearish trend reversals. Additionally, the RSI is below 50 and falling.
If the decrease continues, the TIA price can fall by another 20% and reach the $4.30 horizontal support area.
Cryptocurrency trader Dentoshi has a similar view. He noted a head and shoulders (H&S) pattern, suggesting that the price is not yet done decreasing.
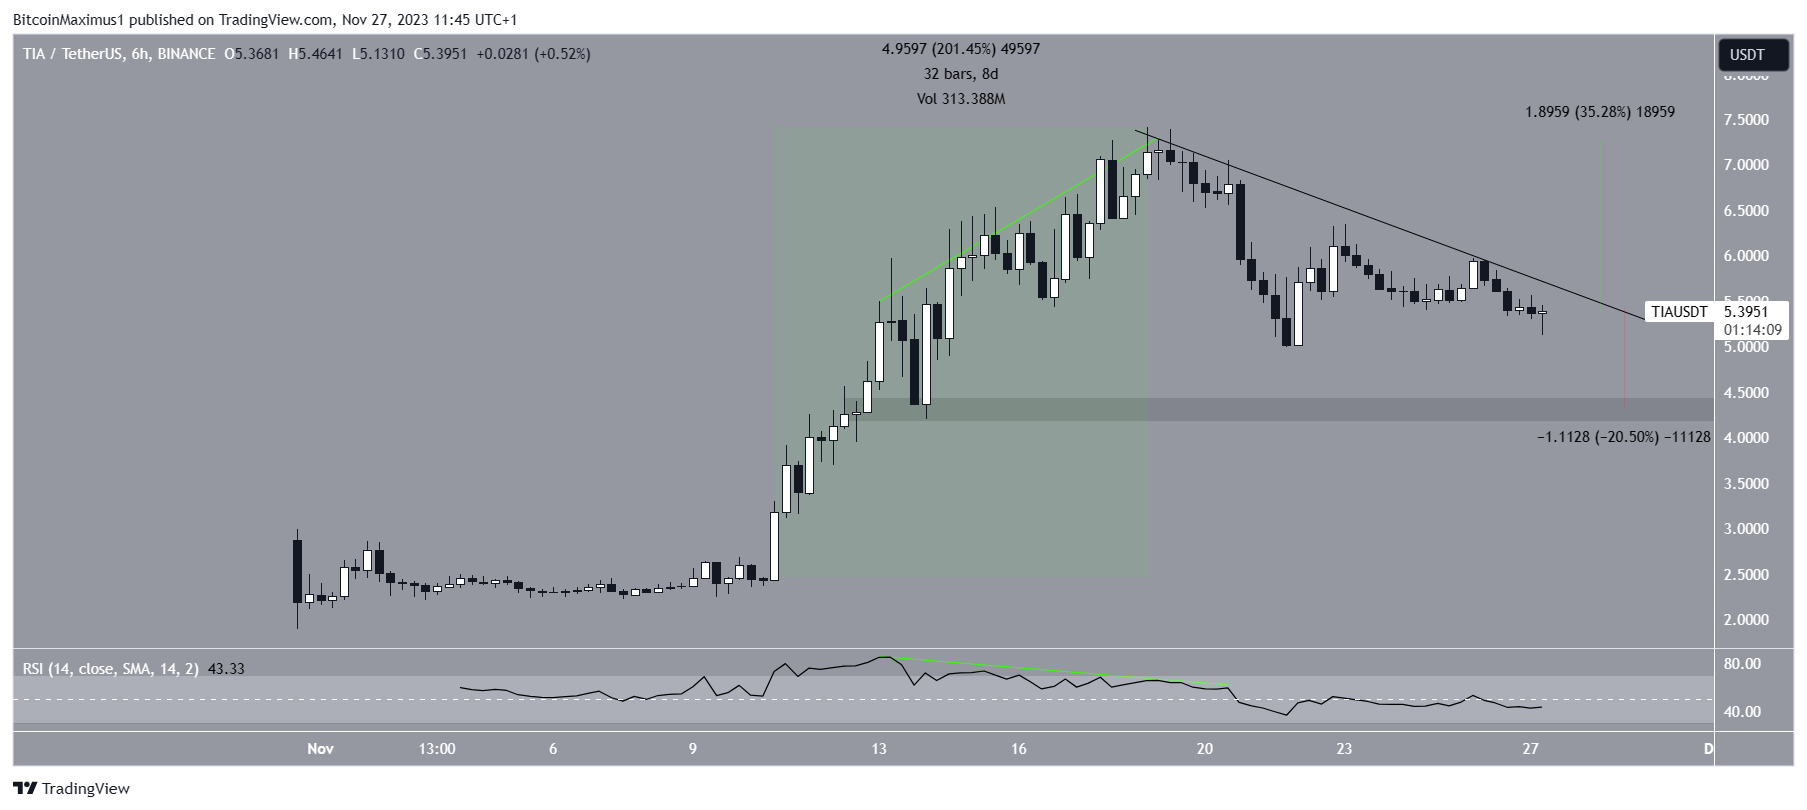 TIA/USDT Six-Hour Chart. Source: TradingView
Despite this bearish TIA price prediction, a breakout from the descending resistance trend line at $5.70 will mean the local bottom is in. In that case, the altcoin can increase by 35% to the all-time high region of $7.30.
Read More: Best Upcoming Airdrops in 2023
Arweave (AR) Upward Movement Comes to an End
The AR price has appreciated significantly since October 20. The altcoin increased by 150% in only 32 days, culminating with a high of $9.30 on November 19.
However, the price created a long upper wick the same day (red icon), a sign of selling pressure. The wick validated a confluence of resistance levels at $8.50, created by a horizontal resistance area and a long-term descending resistance trend line.
Additionally, the high was combined with bearish divergence (green) in the RSI, another sign of an impending drop.
If the AR decrease continues, the price can fall by another 20% and reach the closest support at $6.
Cryptocurrency analyst Rekt Bidding also suggested that the price could fall to its closest support at $6 before eventually resuming its increase.
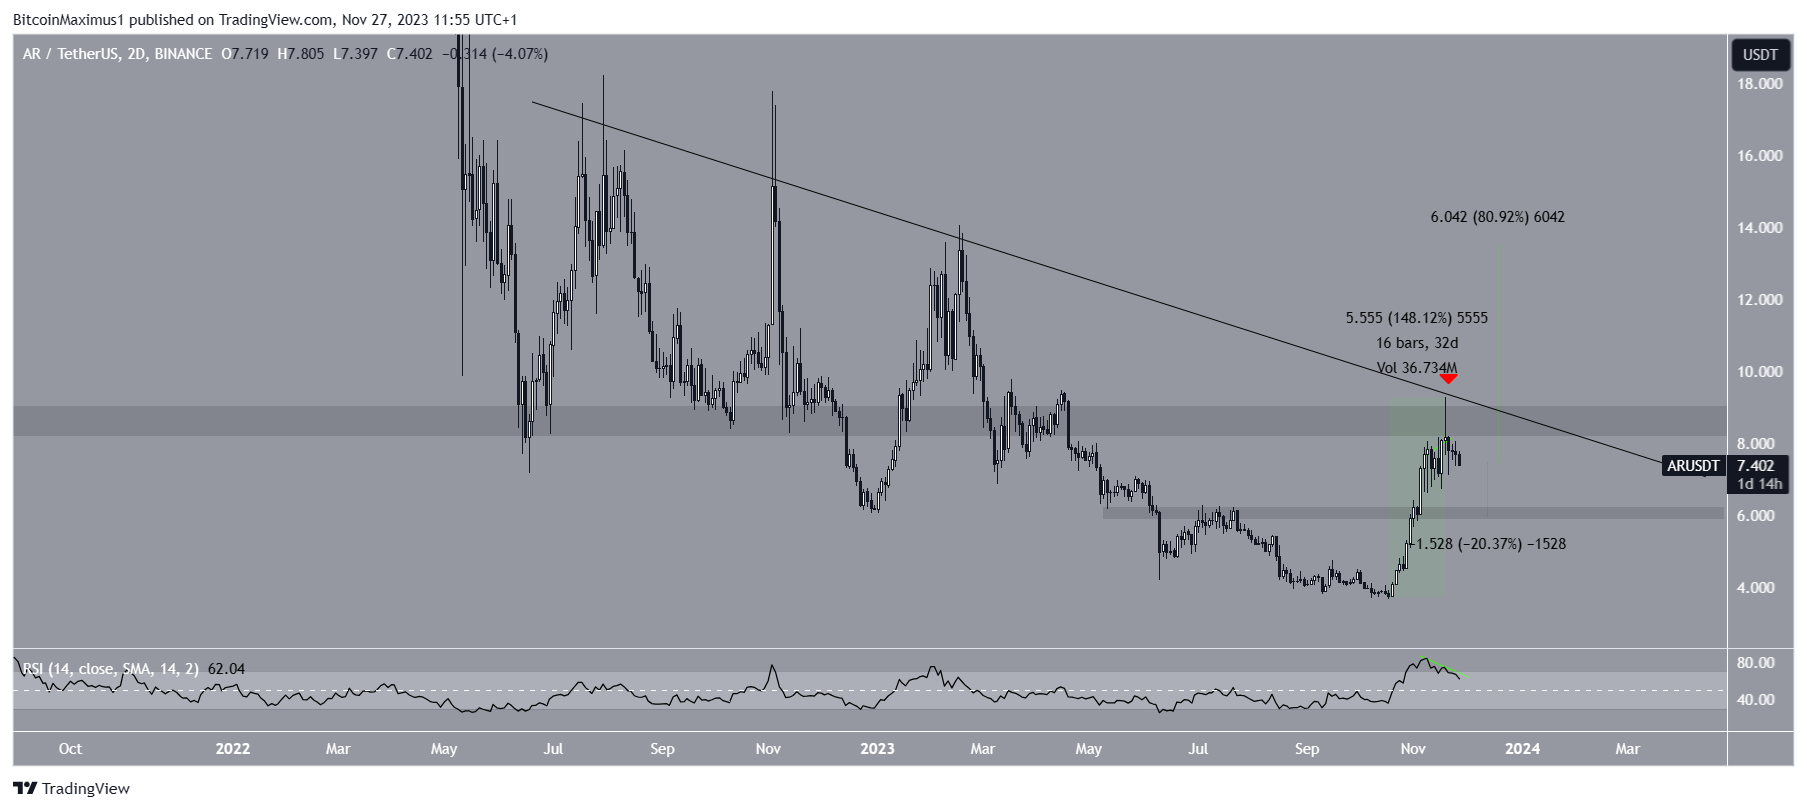 AR/USDT Two-Day Chart. Source: TradingView
Despite this bearish AR price prediction, a close above the $8.50 resistance and descending resistance trend line will invalidate the bearish forecast. In that case, the altcoin can increase by 80% and reach the next resistance at $13.50.
Read More: 9 Best Crypto Demo Accounts For Trading
PancakeSwap (CAKE) Concludes Bearish Cryptos in December
The CAKE price has been mired in a rapid upward movement since October 16. The movement led to a high of $2.85 on November 15, an increase of 170% since the October lows.
However, the price failed to sustain its increase and fell below the $2.50 horizontal area, validating it as resistance. Additionally, the RSI generated a bearish divergence (green), preceding the entire drop.
Finally, CAKE has broken down from a short-term ascending support trend line, further aligning with the previous bearish readings.
It is worth noting that the PancakeSwap team announced epoch 3 of the King of Degen competition, tweeting:
Dive into Epoch 3 of the King of Degen competition on PancakeSwap Perpetuals v2 – $36,000 USDT worth of APX is up for grabs!
Epoch wraps up at 23:59 (UTC), Dec 03, 2023
If the drop continues, CAKE can fall by another 20% towards the 0.5-0.618 Fib retracement support levels at $1.73-$1.94.
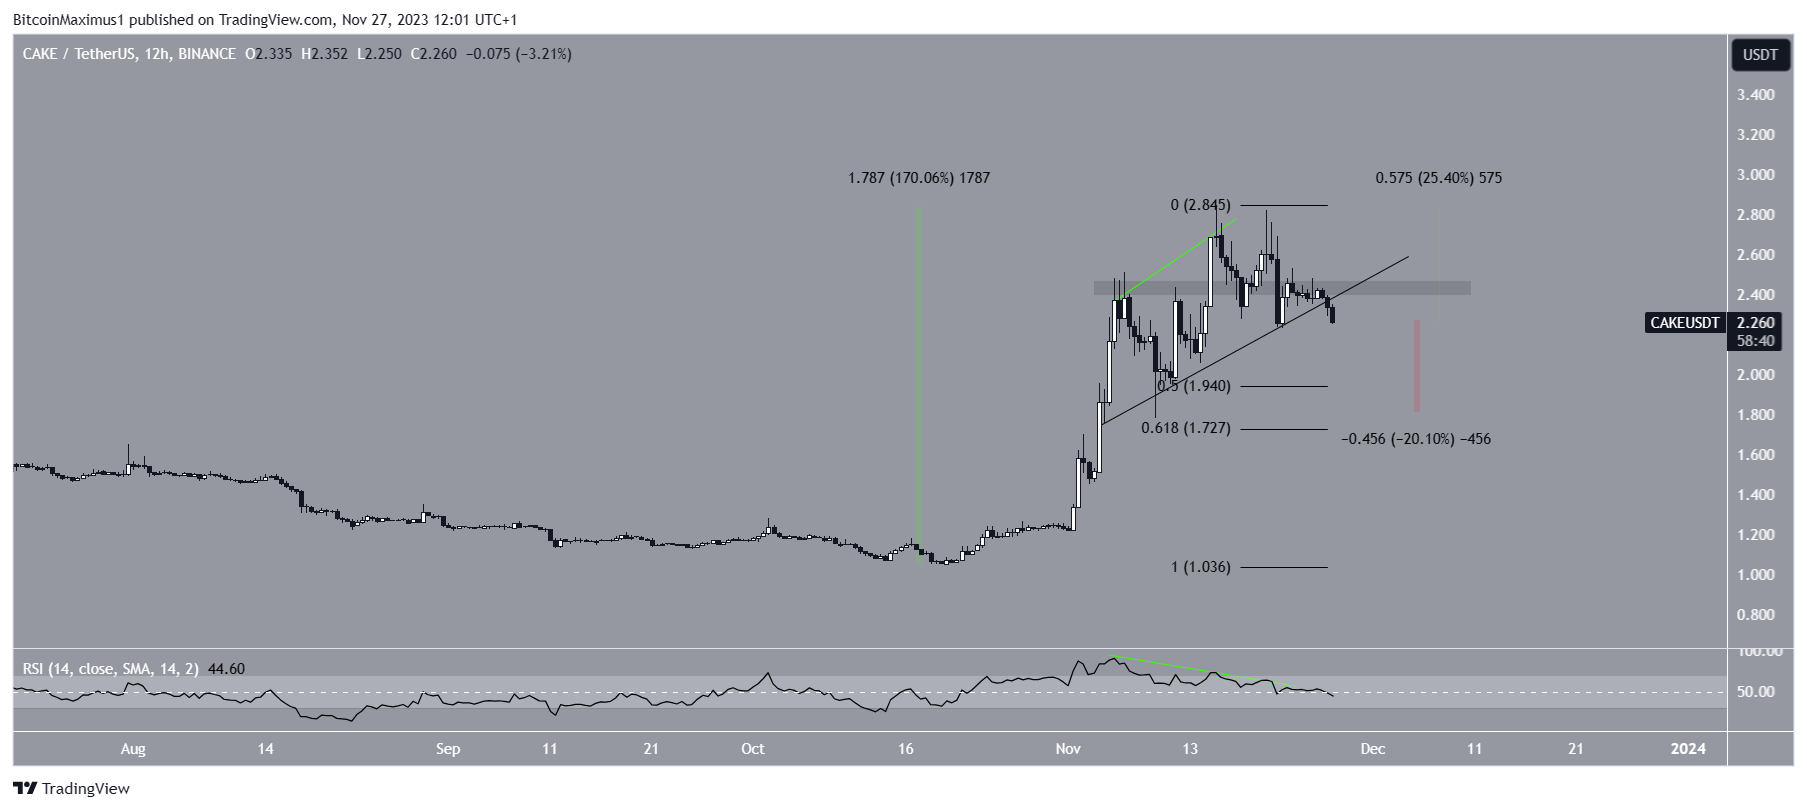 CAKE/USDT 12-Hour Chart. Source: TradingView
Despite this bearish CAKE price prediction, reclaiming the $2.50 resistance area can cause a 25% increase to the next resistance at $2.85,
For BeInCrypto’s latest crypto market analysis, click here.
1
1


 Manage all your crypto, NFT and DeFi from one place
Securely connect the portfolio you’re using to start.


0
0