
Zcash Price Prediction: $ZEC Eyes Top 10 All-Time High Coming?

0
0
$ZEC and $HYPE are now neck and neck for the 9th spot by market cap, according to CoinGecko, with barely $1 billion separating them. At the same time, Grayscale says Zcash mining is now more profitable than mining Bitcoin, and mining activity has jumped over 250% in 2026 as a result.
ZEC is Down nearly 2% on the day, pushing back toward its recent highs. This Zcash price prediction checks that momentum against what the chart is actually showing.
Market data was checked on September 14, 2026, based on the chart timestamped 9:57 (UTC).
Zcash Price Prediction Today: Market Overview
Metric | Value |
Price | $1,113.37 |
Market Cap | $18.75B (-2.33%) |
24h Volume | $1.63B (+70.07%) |
Vol/Mkt Cap (24h) | 8.75% |
FDV | $23.23B |
Total Supply | 16.86M |
Max Supply | 21M |
Circulating Supply | 16.86M |
Source: Data from CoinMarketCap as of September 14, 2026, at 9:21 IST. Figures may vary slightly across other tracking websites.
ZEC vs HYPE: Crypto News Today
CoinGecko flagged $ZEC and HYPE as neck and neck for the 9th and 10th spots by market cap, with Zcash at $18.73 billion and Hyperliquid at $17.66 billion at the time of the post.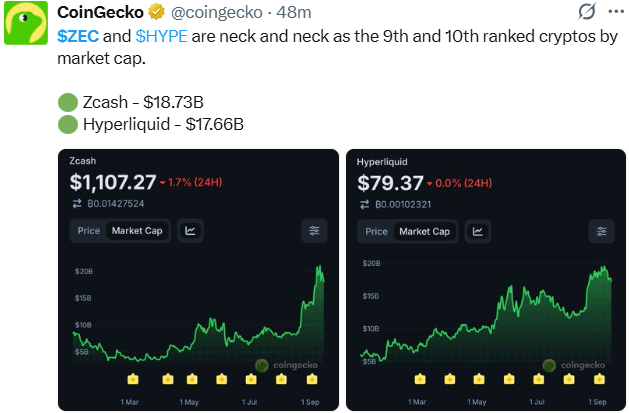
Source: Data From CoinGecko
Zcash News: Mining Profitability Surges
BSCN reported that mining Zcash is now more profitable than mining Bitcoin, citing Grayscale data showing ZEC mining produces double the rewards per rig and four times as much per megawatt compared to Bitcoin.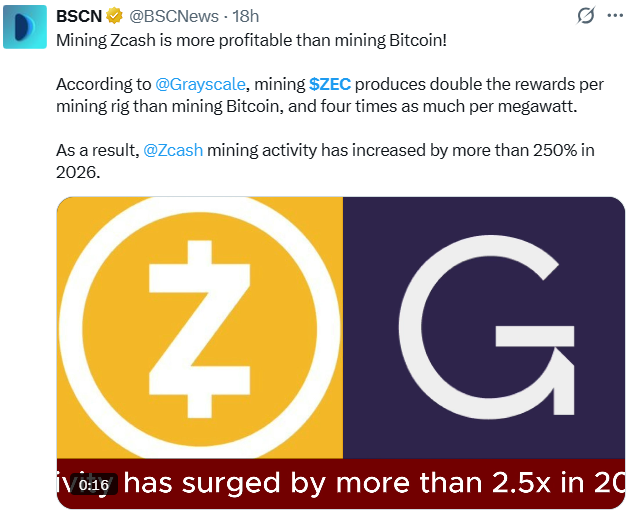
Source: Data From X
As a result, Zcash mining activity has reportedly increased by more than 250% in 2026.
ZEC Price Prediction Chart: Technical Analysis
Pair: ZEC/USD · Market: Spot (Crypto index) · Timeframe: 1D · Timestamp: September 14, 2026, 00:57 UTC-3
ZEC trades at $1,113.37, holding above a rising trendline that has supported the move since mid-August.
Price is consolidating just under its nearest resistance after a sharp early-September rally.
RSI (14, Relative Strength Index) reads 61.18, bullish but not yet overbought.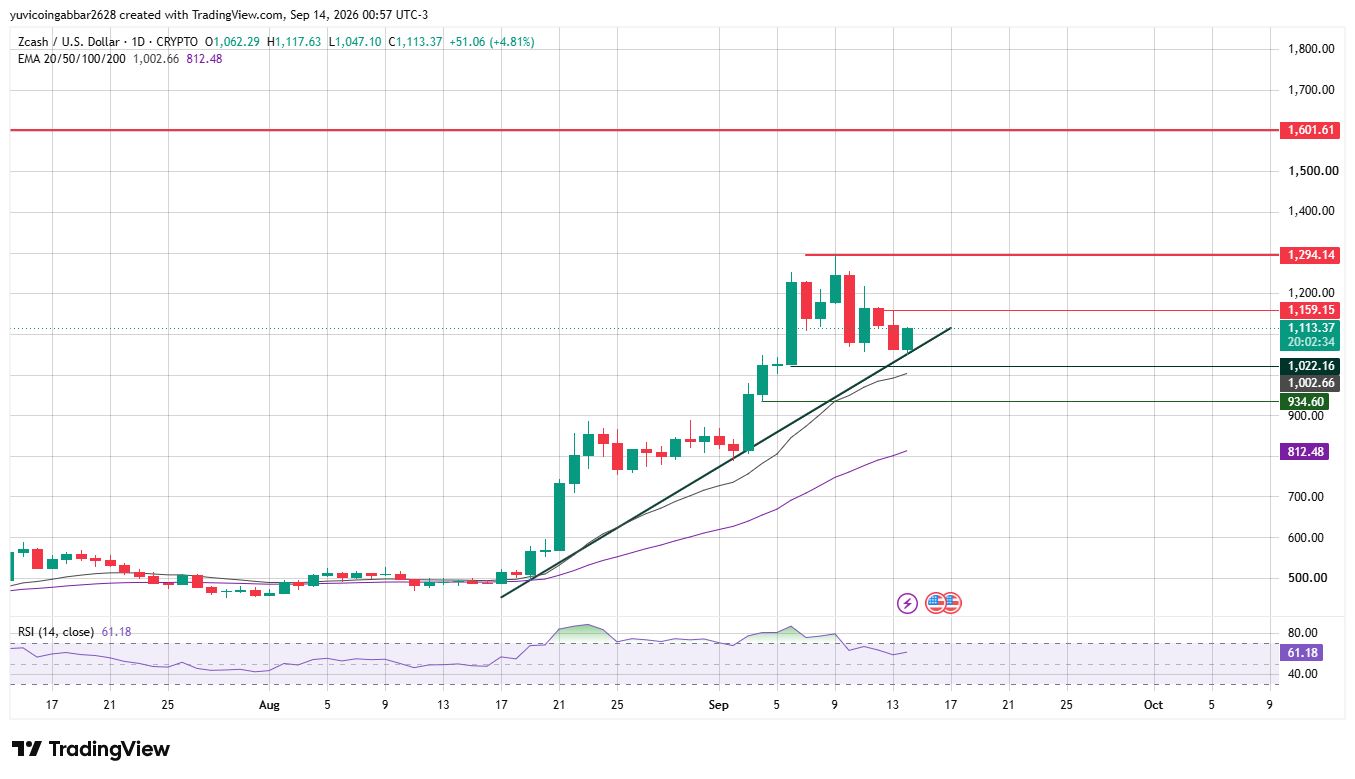
$ZEC Key Levels to Watch: Zcash Outlook
Level Type | Price |
Resistance 3 | $1,601.61 |
Resistance 2 | $1,294.14 |
Resistance 1 (nearest) | $1,159.15 |
Immediate Price Reference | $1,113.37 |
First Confirmed Support | $1,022.16 |
Deeper Support | $934.60 |
ZEC Forecast: Bull Case vs Bear Case
Bull case: Clearing $1,159.15 would open the path toward $1,294.14 and then $1,601.61, with the mining-profitability story and the HYPE ranking battle both adding to the bullish narrative.
Bear case: Losing the rising trendline support alongside $1,022.16 would expose $934.60, putting the September rally in question even with the positive mining and ranking headlines still intact.
Zcash Price Forecast: $ZEC Triggers and Invalidation
Scenario | Trigger | Likely Outcome | Invalidation Point |
Resistance breakout | Close above $1,159.15 | Push toward $1,294.14 | Rejection back below $1,113.37 |
Trendline hold | Bounce from $1,022.16 | Range continues toward resistance | Close below $1,022.16 |
Trendline breakdown | Close below $1,022.16 | Slide toward $934.60 | Reclaim of $1,022.16 |
Zcash Crypto Price Prediction: Can $ZEC Reach $1,601.61?
$1,601.61 is the highest resistance marked on the chart. Getting there would require $ZEC to first clear $1,159.15, then $1,294.14, a multi-stage move rather than a single leg.
Zcash Price Prediction 2026: Expert View
According to CoinGabbar analysts, The mining profitability story and the HYPE ranking battle are keeping sentiment upbeat, but $ZEC still needs to clear $1,159.15 to confirm the next leg up.
The $1,022.16 to $1,159.15 zone is what matters this week.
Disclaimer
This piece is for informational purposes only and isn't financial advice. The levels and scenarios above are based on technical chart analysis and publicly available data at the time of writing, and crypto markets can move sharply within hours, so past patterns don't guarantee future outcomes. It's worth doing independent research and considering your own risk tolerance before acting on any of the levels discussed here.
0
0


 Manage all your crypto, NFT and DeFi from one place
Securely connect the portfolio you’re using to start.


