
Hoodrat Price Prediction: Why HOODRAT Is Gaining Attention

0
0

Something weird is happening on this chart, and honestly, nobody expected it.
$HOODRAT is sitting a little above a penny right now, up well over 155% in a single day, and that's exactly why Hoodrat price prediction chatter is heating up. Coins that move like that usually crash back down fast. This one hasn't. Sellers have tried knocking it down a handful of times, and each time buyers just absorbed it and kept walking.
Every dip toward the rising trendline gets bought. Selling pressure keeps shrinking, a shift also showing up across parts of the altcoin market.
No spike, no crash. Just a slow, steady grind, the kind that usually breaks hard in one direction.
Hoodrat Coin Overview And Key Market Snapshot Right Now
| Field | Data |
|---|---|
| Coin Name | Hoodrat |
| Ticker Symbol | HOODRAT |
| Blockchain | Ethereum (ERC-20), Robinhood Ecosystem |
| Today High | $0.01691 |
| Today Low | $0.00498 |
| RSI Level | 61.23 |
| Token Type | Meme Coin |
| Token Category | Meme, Robinhood Ecosystem |
| Market Cap | $14.31M |
| 24H Trading Volume | $10.47M |
| Circulating Supply | 1,000,000,000 HOODRAT |
| 24H Change | +155.0% |
Source: Data by CoinGecko
What Exactly Is Hoodrat And Why Traders Noticed It
$HOODRAT is a meme coin built on the Ethereum network under the ERC-20 standard, trading through Uniswap V2. It leans on the Robinhood ecosystem theme, a category of tokens riding the attention around retail trading culture.
It launched quietly and spent days barely moving before this week's breakout. Beginners are only now discovering it, the same way many first spot fresh names through presale projects long before those tokens ever trade on an exchange.
Why This Coin Is Getting Attention Beyond The Chart
We pulled up the holder data, and the first thing that stood out was how fast it is growing. Over four thousand wallets now hold $HOODRAT, and transfer activity has crossed 127,000, both climbing fast in a short window.
Technical Price Analysis: Reading The Ascending Triangle Setup
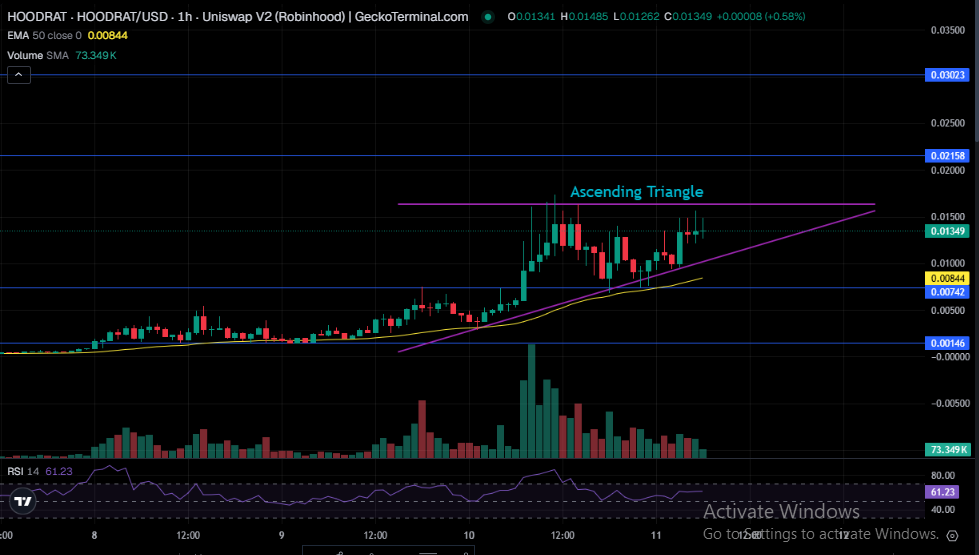
On the 1-hour chart, price is slowly squeezing toward resistance, keeping the ascending triangle setup intact.
Source: Charting by Gecko Terminal
Price is trading well above its 50 EMA of $0.00844, and that gap alone confirms buyers are firmly in control of the short-term trend. RSI at 61.23 is strong without being overheated yet.
But here's what most traders are missing. Volume on the recent pullbacks has been noticeably lighter than the volume on the pump itself. Weak selling into strong buying is exactly the setup breakout traders look for.
Resistance sits at $0.01691, the recent all-time high. A close above that on strong volume opens the door toward $0.02158 and eventually the $0.03023 zone mapped on the chart.
Short-Term Hoodrat Price Prediction For The Coming Weeks
The next week or two likely decide whether this triangle breaks up or fails. A clean close above resistance with volume confirms continuation, while a fade back under the trendline would flip this bullish.
| Timeframe | Bearish Target | Base Target | Bullish Target | Key Trigger |
|---|---|---|---|---|
| 24 Hours | $0.0110 | $0.0140 | $0.0169 | Reaction at triangle resistance |
| 3–7 Days | $0.0090 | $0.0150 | $0.0216 | Breakout confirmation with volume |
| 2–4 Weeks | $0.0060 | $0.0170 | $0.02802 | Sustained retail and holder growth |
Watch the resistance zone closely. It decides the next two weeks.
Long-Term Hoodrat Price Outlook Through Next Year
Long-term is a different conversation entirely, because meme coins live and die on attention, not fundamentals. Hoodrat needs continued community growth and fresh exchange listings to justify holding these levels into next year.
| Timeframe | Bearish Target | Base Target | Bullish Target | Catalyst Needed |
|---|---|---|---|---|
| 3 Months | $0.0040 | $0.0120 | $0.0290 | Sustained exchange listing momentum |
| 6 Months | $0.0025 | $0.0100 | $0.0350 | Continued Robinhood ecosystem narrative |
| End of Year | $0.0015 | $0.0090 | $0.0450 | New wallet growth staying elevated |
| 2027 Outlook | $0.0010 | $0.0080 | $0.0600 | Broader meme coin cycle strength |
Honestly, the long-term case is speculative at best and depends heavily on whether attention sticks around.
Three Price Scenarios Traders Should Prepare For
Worst Case: Resistance holds a third time and momentum traders exit fast. Price could slide back toward $0.006 if the trendline breaks with volume.
Base Case: Price consolidates under resistance for another week before testing the breakout again. Holder growth continues steadily either way.
Best Case: A volume-backed close above $0.01691 triggers a fast move toward $0.0216 and beyond. Retail attention accelerates the breakout.
| Scenario | Price Range | What Triggers It |
|---|---|---|
| Worst Case | $0.004 - $0.007 | Trendline breaks as sellers overwhelm demand. |
| Base Case | $0.011 - $0.015 | Sideways consolidation below resistance. |
| Best Case | $0.017 - $0.023 | Confirmed breakout backed by strong trading volume. |
Key Hoodrat Price Levels Every Trader Should Watch
Resistance zone: $0.01691 to $0.02158, the ceiling this triangle has tested repeatedly.
Support zone: $0.00844 near the rising 50 EMA, the level buyers have defended so far.
Invalidation zone: Below $0.00146, where the entire bullish structure would break down.
Analyst View And Final Thoughts On The Hoodrat Setup
The chart tells a fairly clean story right now. Price sits above its EMA, RSI is constructive, and the pattern is textbook continuation if it plays out.
A weekly close above $0.01691 would confirm buyers are still in charge and open room toward the next resistance band fast. Holder growth needs to keep pace for that to stick.
Sentiment gauges like the Fear and Greed Index are worth a glance too, since retail-driven names like this one often move with the crowd's mood swings.
The most important level remains $0.01691. Everything Hoodrat does next likely starts there.
The triangle is tightening. Something has to give soon.
Disclaimer: This article is for educational purposes only and does not constitute financial advice. Crypto markets are volatile. Consult your investment advisor before making any investment decision.
0
0
 Manage all your crypto, NFT and DeFi from one place
Securely connect the portfolio you’re using to start.