Bitcoin Trapped Between Key Holder Levels — $90K Rally or $66K Drop Next?

0
0

Bitcoin has erased the gains it accumulated on Sunday. It currently trades at $80,700 after another rejection above $82k.
The asset is off to a bad start this week, shedding almost 2%. It raises questions about the next price action, considering the notable increases it had last week. It ended the previous session with gains of almost 5%, resuming its uptrend after a brief pause two weeks ago.
In hindsight, the first ten days of May have been significantly bullish for the apex coin, with the coin up almost 6%. Looking at the previous week, it surged to its highest level since January, reaching $82,833. The selling congestion at $83k continues to expand, suffocating any serious attempts above $82k.
Some of the biggest news during this period was the resumption of hostilities in the Middle East. Investors feared it might drag the US in. Macroeconomic data were also some of the top movers during the session.
However, amid the push for further gains, the bulls are struggling to muster the necessary volume to sustain the uptrend. Recent data from CryptoQuant shows that the sharks, the group behind the recent price uptrend, have resumed buying, accumulating over 64k BTC. Nonetheless, the figures are not as high as they were in April. Additionally, the humpback (over 10k BTC holders) are now selling.
Away from the spot market, the selling pressure is spreading into ETFs. The investment firms offering these funds opened the previous week with balances of 1.36 million BTC, but ended slightly lower for the first time in the last five weeks. Nonetheless, the firms held more BTC than they did since October.
The Outlook for Bitcoin This Week
The apex coin is currently trading above $80k. The recent decline in the first half of Monday resulted in speculation that the uptrend is over. Given some bearish onchain readings last week, fear has increased.
Still on last week’s price action, BTC saw a slight increase in the early hours of Monday but was rejected around $82,300. It faced a similar rejection on Sunday, suggesting that selling pressure is increasing at this level.
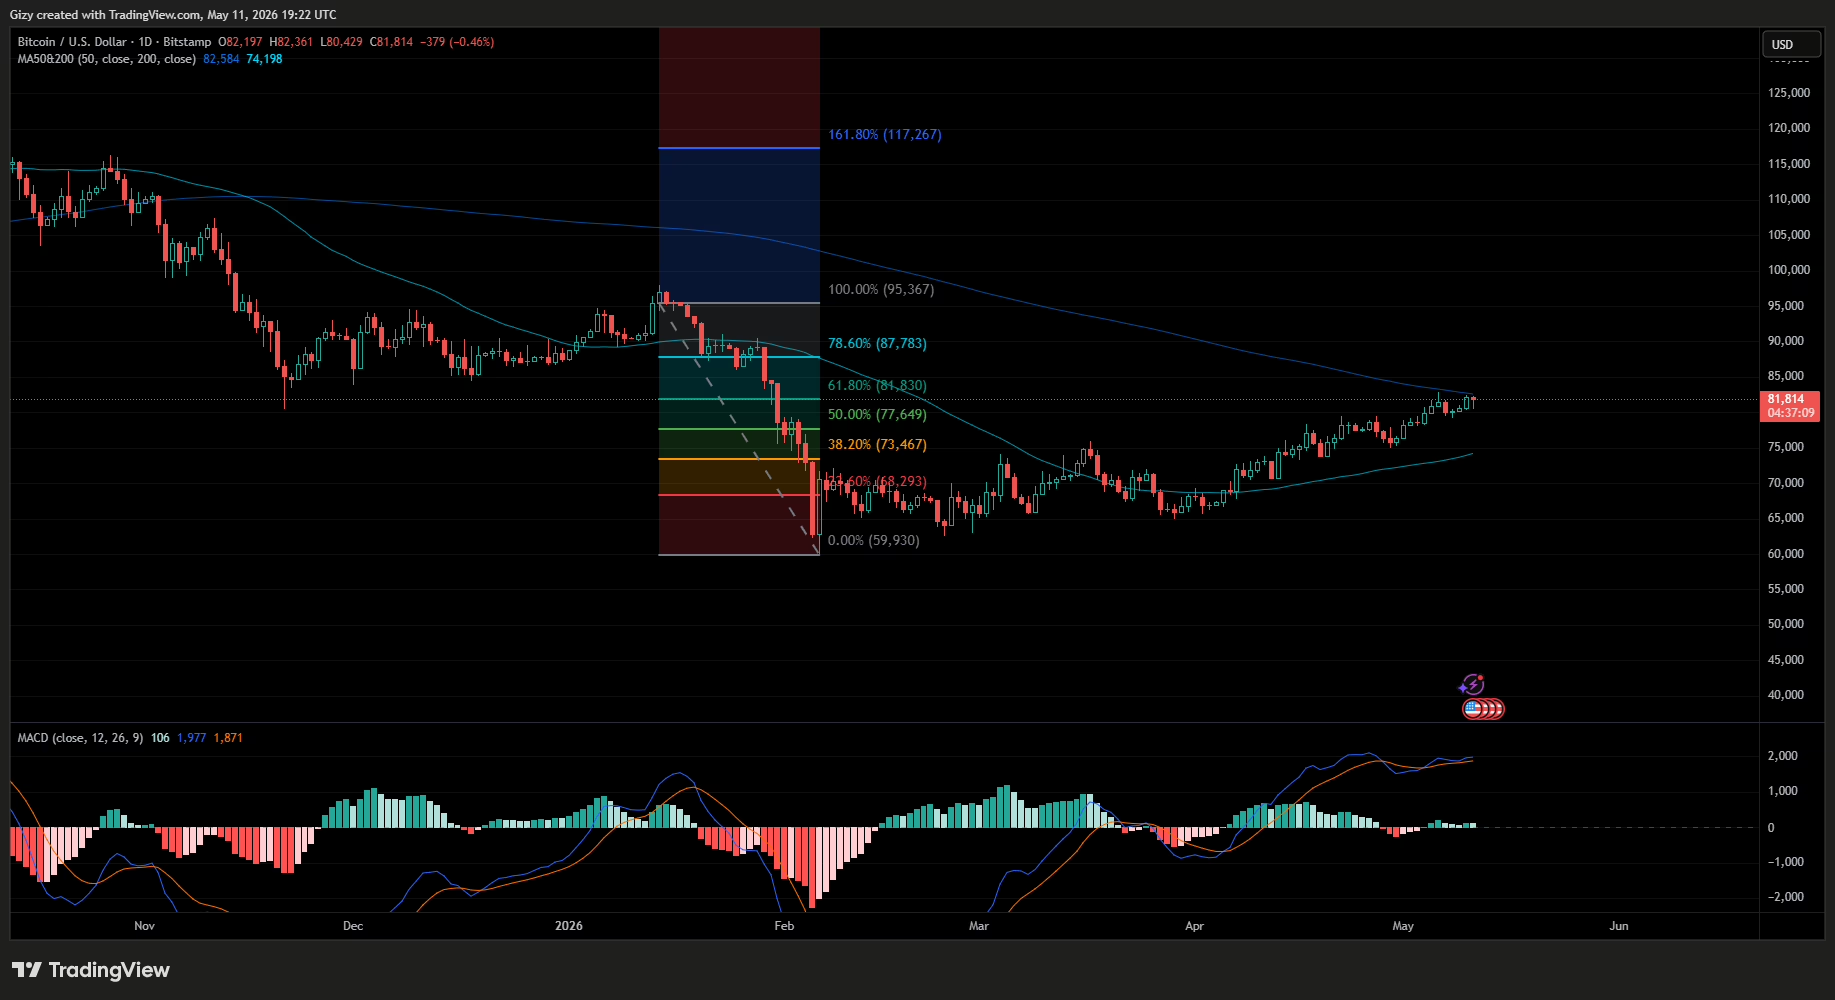
Based on current 1-day chart readings, BTC may continue to rise this week. The moving average convergence divergence had a bullish crossover last week. It maintains its bullish structure amid the selling pressure. With the bulls still in control, the apex could push higher starting Tuesday.
Aside from MACD, the 200-day moving average is at $82,584. Either of these scenarios will play out; the first, it may become tough resistance as seen last week. The second, break above the metric on Tuesday.
Bitcoin is likely to experience the second variant, as, when expanding the chart to the 1-week, the indicator is at $94,715.
In addition to the MA, recall that a previous analysis noted the apex coin has an unfilled CME gap extending to $84k. It failed to fill it last week; the next six days will provide another opportunity to retest the key level.
Investors are also expecting the US BLS macro data release. One of the biggest releases of the week is the NFIB Optimism Index, and the forecast is positive. Aside from that, analysts also predict a positive CPI outcome. If they come out as expected, they may fuel the surge to $84k, with some speculating a rise to $85k.
Interestingly, the fibonacci retracement levels point to further benefits of filling the gap. BTC is currently trading at the 61% mark; sustaining a rise above this level could send the apex coin above $87k.
It’s not all Bullish for Bitcoin
While some indicators point to further increases, it is important to consider the possibility that the 200-MA could be tough resistance. If that happens, the predictions of filling the CME gap this month become almost zero.
While macroeconomic data could fuel further increases, it is a two-edged sword. For example, core CPI and PPI are projected to rise. Additionally, the initial jobless claims may also increase. If they come as forecasted, prices will plummet even lower.
Adding to the concern is mounting selling pressure. As of the time of writing, orderbooks on Binance and OKX show significant sell orders near $83k. These orders are significantly higher than the $80k buy order. Fears of further decline are growing, as humpbacks have begun selling.
Additionally, data from Coinglass shows a notable liquidation cluster around $83k. The bears will likely defend this mark.
Away from these readings, there’s a growing consensus that Bitcoin is running out of time. Some analysts contend that this may be the last week of considerable increases.
Crypto Rover stated that this week may be the top for the apex coin. The reason for this conclusion is that since its inception, it has dumped 749 days after halving. May 11 marks 751 days since the last halving, which means that if the trend holds, it will trigger a massive retracement this week.
The analyst added that one factor that will contribute to the start of the downtrend is the appointment of the new Fed Chair. Sentiment around this announcement is rather hawkish, as investors do not expect any significant policy change.
$90k or $66k?
In summary, spot volume is dwindling, and Bitcoin is currently surging due to leverage and fundamentals. Readings from ETFs, spots, and derivatives suggest these factors will wane this week.
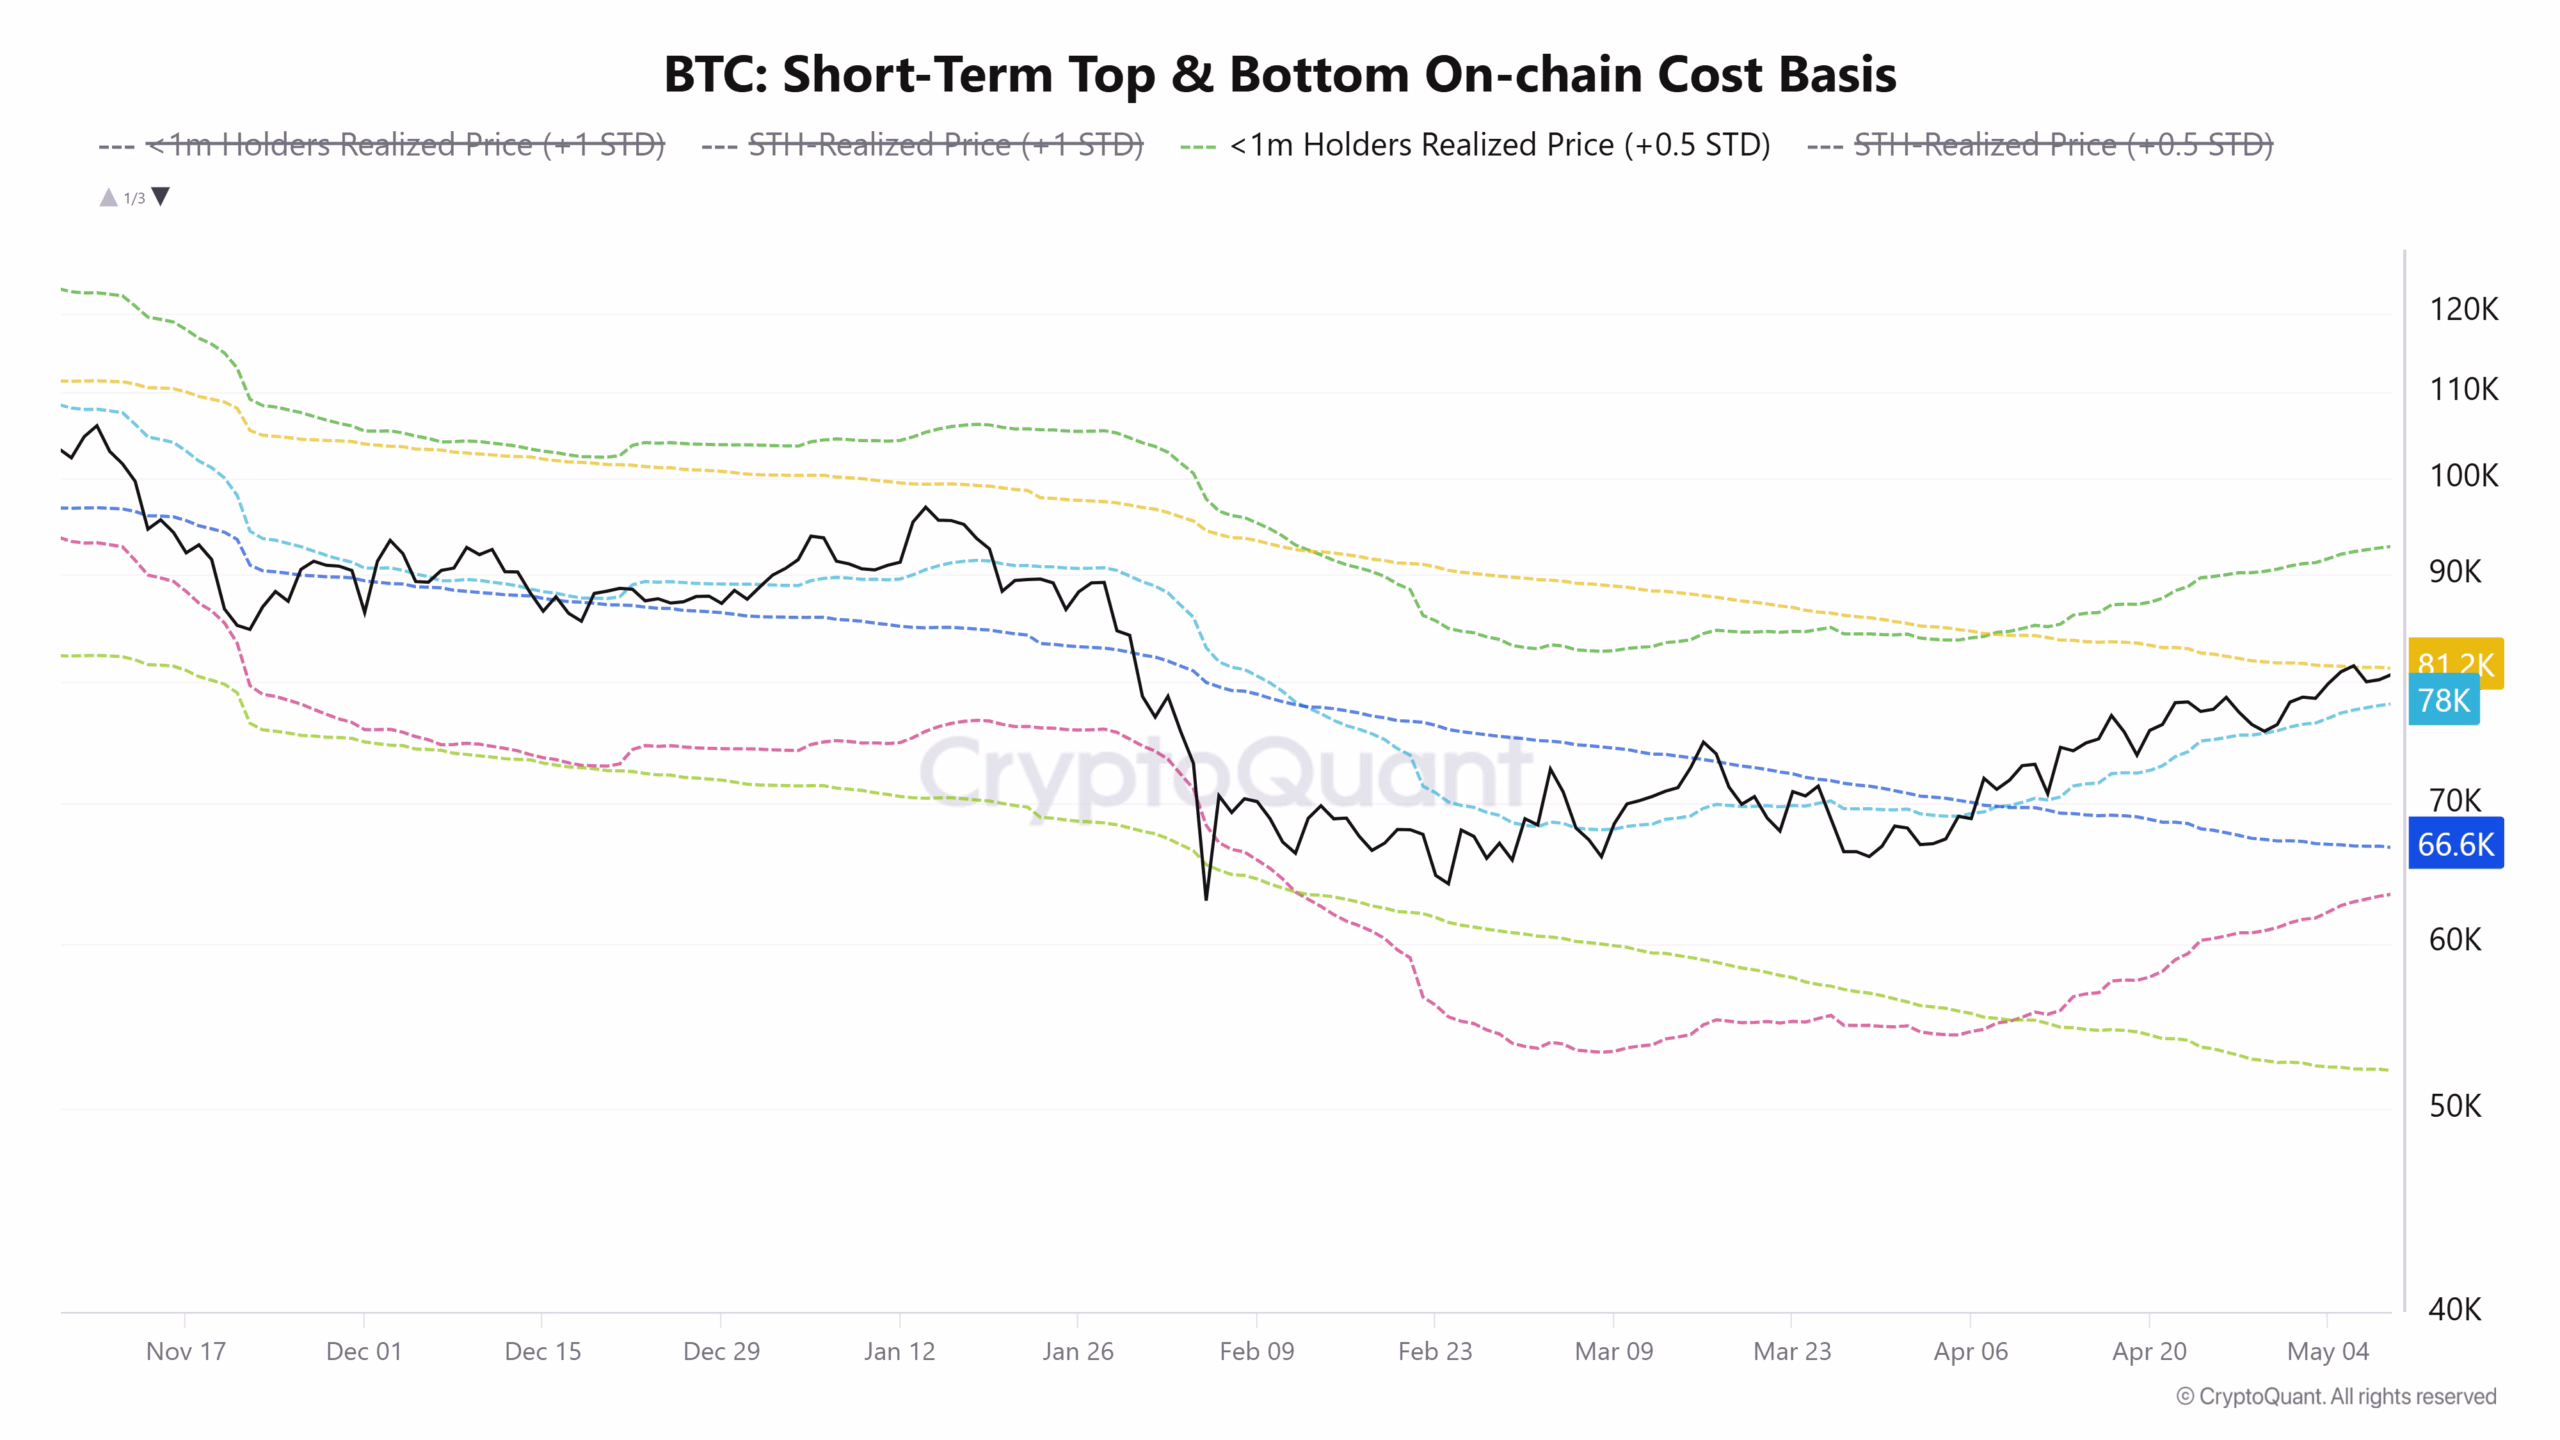
The BTC: Short-term Top and Bottom Cost Basis explains the implication of failing to flip $84k. Last week, short-term holders quickly locked in profits, stifling Bitcoin’s upward momentum. At the same time, another important development is unfolding. Since breaking above the 1-month holders’ cost basis in April, that level has acted as a key support zone, with BTC rebounding from it on three separate occasions.
Meanwhile, the realized price has continued to trend higher, steadily narrowing the gap with the STH cost basis. Price action is now compressing between both metrics.
If this structure holds, Bitcoin could enter a range-bound phase in the coming days. A decisive move above the realized price may open the door for a rally toward $90K. On the other hand, losing the 1-month holders’ cost basis could trigger a decline toward $66K.
In a nutshell, price action will provide confirmation about next price action.
The post Bitcoin Trapped Between Key Holder Levels — $90K Rally or $66K Drop Next? appeared first on CoinTab News.
0
0

 Manage all your crypto, NFT and DeFi from one place
Securely connect the portfolio you’re using to start.

0
0

0
0

0
0

0
0