
Harmony Price Prediction 2026–2030: Can ONE Recover From Here?

0
0
Harmony price prediction talk just changed tone. Harmony (ONE) jumped +22.16% on the daily chart, and RSI hit 92.05.
That move follows a previous Harmony ONE forecast built on a falling channel. The channel just broke.
The breakout is real, but the setup is stretched.
Harmony ONE Price Today and Market Snapshot
ONE is up 23.53% in 24h. Volume is huge. Shorts are getting liquidated.
| Metric | Value |
| ONE price | $0.002349 |
| 24h change | +23.53% |
| Market cap | $35.31M |
| Spot volume | $95.2M |
| Futures volume | ~$604.8M (top six venues) |
| Open interest | $31.30M |
| Circulating supply | 15.02B ONE |
| Analysis timestamp | Sep 19, 2026, 09:53 UTC |
Spot numbers come from CoinMarketCap data.
Harmony Price Prediction: What Is Driving ONE Now?
Ethereum Migration and Harmony Layer-1 Sunset
The Block reported that Harmony plans to sunset its Layer-1, the base blockchain, and migrate ONE to Ethereum. Total supply and emissions stay unchanged under the proposal.
Migration matters for liquidity and utility. But execution risk is real, and firm dates weren't confirmed in the data used here.
Traders should watch wallet migration steps and crypto exchange listing updates.
August 2026 ONE Minting Exploit
The Block reported an August 2026 exploit involving unauthorized minting of ONE. Basically, tokens appeared that shouldn't exist.
The Harmony mainnet exploit analysis covers the fallout.
Turns out, the wreckage set the floor: an all-time low of $0.0002318 printed on August 13, 2026 (UTC).
Harmony's AI Pivot
Harmony has floated an AI-video direction. CMC AI flags it as a major long-term unknown.
Video tools could give ONE real utility. But rivals chase the same theme, tracked in AI crypto news.
Harmony ONE Technical Analysis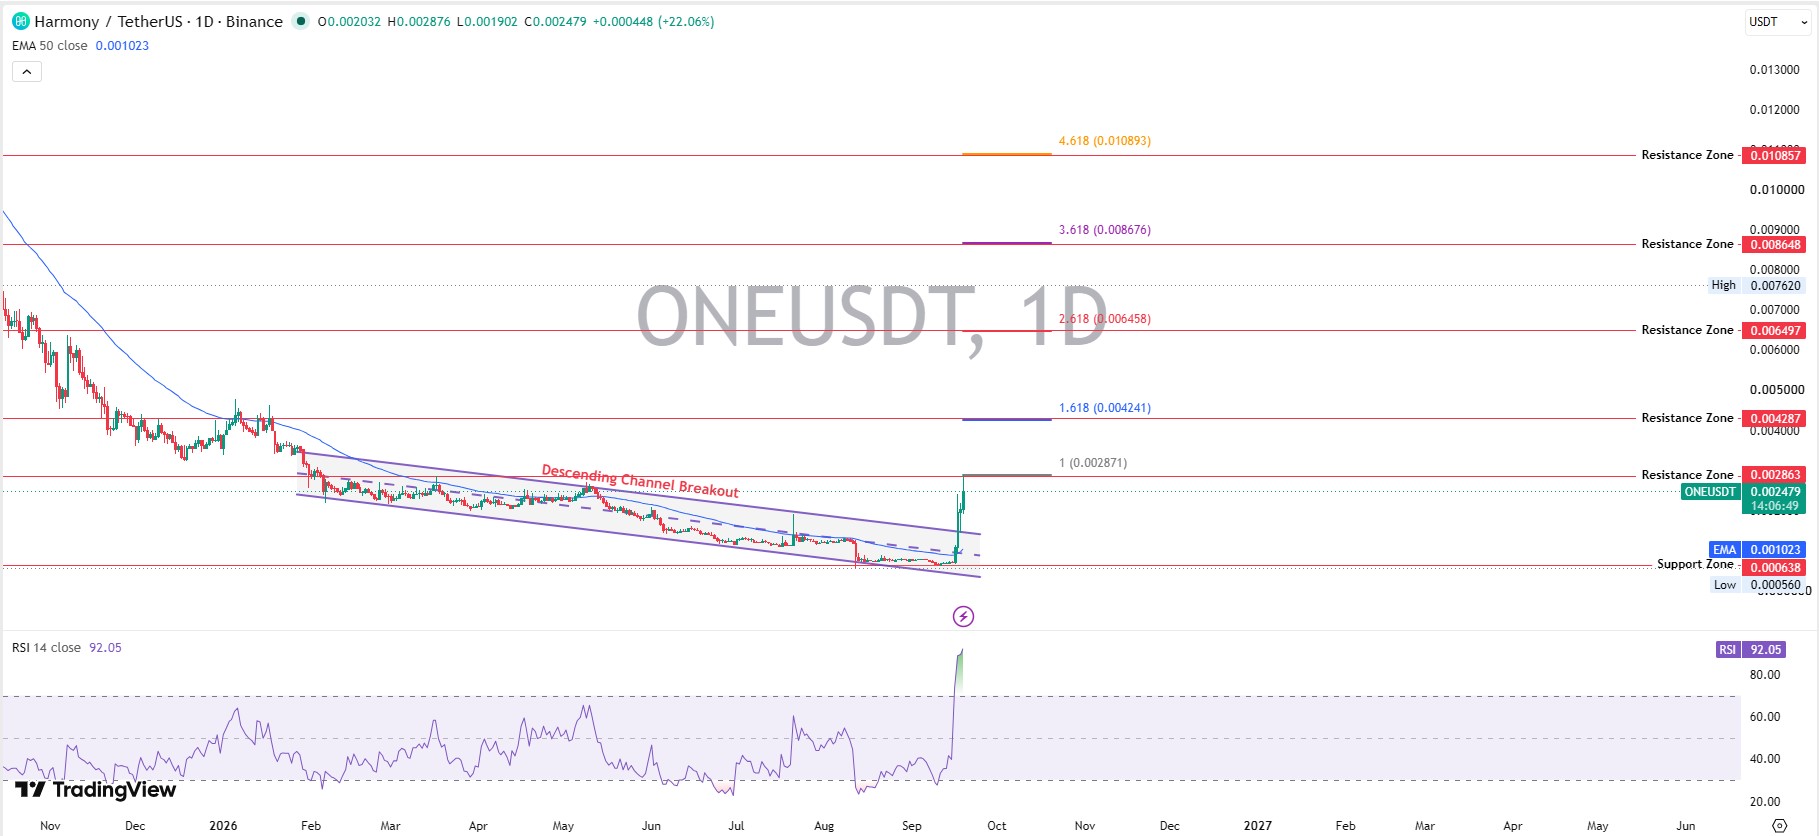
All readings use the Binance ONE/USDT daily chart.
ONE Trend
The breakout seemed clean at first. Actually, "clean" is the wrong word for a candle that added 22% in one day.
Price broke above the descending channel, and MACD confirmed momentum. But a daily trade above $0.002863 is still missing.
Intraday, the candle spiked to $0.002876 and faded to $0.002481. That's rejection at resistance.
Weekly, the lower highs from the $0.3798 all-time high stay intact until $0.004287 breaks, per TradingView charts.
Short-term stance: bearish. Structure: unconfirmed.
ONE RSI and Momentum
Pulling up the daily RSI (Relative Strength Index, a 0-100 momentum gauge), the first thing that stood out was 92.05. Above 70 counts as overbought.
MACD (Moving Average Convergence Divergence, a trend tool) sits at 0.000258 against a 0.000061 signal line.
But positive momentum at RSI 92.05 is stretched. Cooling usually comes first.
ONE Moving Averages
The 50-day EMA (exponential moving average, which weights recent prices more) sits at $0.001023.
Price trades roughly 142% above it, and the gap keeps widening, which is exactly when pullbacks arrive.
ONE Trading Volume
Spot volume fell 41.98% to $95.2M while price rose. That's weak confirmation.
Pulling the derivatives feed, the second thing that stood out was futures volume: about $604.8M across six venues, roughly 6x spot, via CoinGlass derivatives data.
Shorts got squeezed first, and then
Late buyers chased. Shorts made up $1.49M of $2.41M in 24h liquidations.
So who's buying at these prices?
Binance pairs hold 77.09% of spot volume.
Breakout and Breakdown Levels
Price broke out, MACD agreed, confirmation is missing, and pullback risk stays high.
Harmony ONE Support and Resistance Levels
Levels below come from the daily chart, and other crypto price predictions use similar logic.
| Level | Type | Why It Matters | Confirmation |
| $0.006497 | Resistance | 2.618 Fibonacci extension | Weekly trade above |
| $0.004287 | Resistance | 1.618 Fibonacci extension | Break plus volume |
| $0.002863 | Resistance | Today's rejection | Daily trade above |
| $0.001023 | Support | 50-day EMA | Hold on retest |
| $0.000638 | Support | Channel base, low $0.000560 | Daily hold |
Harmony Price Prediction 2026
The ONE price prediction for 2026 uses scenarios, not one target.
Migration milestones on a coin events calendar can shift these ranges fast.
| Scenario | 2026 Range | What Must Happen | Invalidation |
| Bear | $0.0009–$0.0016 | Weak adoption, security fears | Recovery catalyst |
| Base | $0.0016–$0.0035 | Stabilization, migration execution | Loss of $0.001023 |
| Bull | $0.0035–$0.0065 | Strong liquidity, smooth migration | Failed break of $0.004287 |
Harmony Price Prediction 2027–2030
ONE Price = Implied Market Cap ÷ Circulating Supply.
With about 15B ONE, $100M equals ~$0.0067 and $1B equals ~$0.0667. These are scenarios, not guarantees.
| Year | Bear | Base | Bull | Driver |
| 2027 | $0.003–$0.008 | $0.008–$0.020 | $0.020–$0.040 | Migration |
| 2028 | $0.003–$0.010 | $0.012–$0.030 | $0.030–$0.070 | Utility |
| 2029 | $0.004–$0.012 | $0.015–$0.040 | $0.040–$0.12 | Ecosystem |
| 2030 | $0.005–$0.015 | $0.020–$0.060 | $0.060–$0.15 | Demand |
Even the 2027 bear range sits above today's price. Those ranges assume migration at least partly works.
2027: Migration Becomes the First Major Test
Bear: $45M–$120M market cap. Base: $120M–$300M. Bull: $300M–$600M.
Success means a working ONE market, not a chain swap.
2028: Utility and Liquidity Take Over
Bear: $45M–$150M. Base: $180M–$450M. Bull: $450M–$1.05B.
2029: Ecosystem Growth Expands Valuation
Bear: $60M–$180M. Base: $225M–$600M. Bull: $600M–$1.8B.
Incentives like crypto airdrops can spark activity, but sustainable users decide the range.
2030: Sustainable Demand Decides
Bear: $75M–$225M. Base: $300M–$900M. Bull: $900M–$2.25B.
A $1 ONE needs a $15B market cap. Not impossible. Just a different valuation regime.
What Could Push ONE Higher?
Successful Migration
A clean Ethereum move would restore trust and open deeper markets.
Improved Security
Proof of hardened contracts would ease the exploit overhang.
New Utility
A working AI-video product could give ONE a reason to be held.
Stronger Trading Liquidity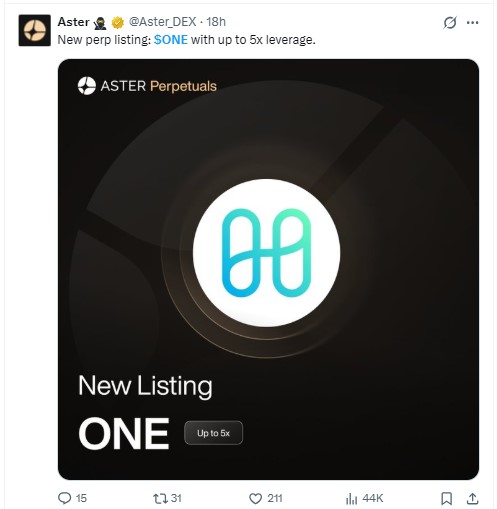
Fresh venues help, and Aster's ONE perp listing adds perpetual futures with up to 5x margin. But margin cuts both ways.
Broader Altcoin Market Recovery
A stronger altcoin tape lifts small caps first.
What Could Push ONE Lower?
Migration Failure
Delays or bugs would stall liquidity plans.
Further Security Problems
Another exploit would reset trust to zero.
Weak Ecosystem Activity
CeFi yields are thin: Gate pays 0.18%, and KuCoin 2.00%–4.00%.
Supply/Dilution Concerns
Basically, 1.61B ONE (9.6%) stays locked, and the top explorer address holds 40.70%.
Broad Crypto Market Weakness
Small caps fall hardest when Bitcoin sags, and memecoin market news shows how fast speculative flows reverse.
Bull, Base and Bear Case for ONE
Near-term stance: bearish. Long-term stance: unproven.
| Scenario | Likelihood | Price Range | Trigger | Invalidation |
| Bull | Lower | $0.0035–$0.0065 | Migration success plus volume | Rejection at $0.004287 |
| Base | Highest | $0.0016–$0.0035 | Range trade, EMA holds | Daily trade below $0.001023 |
| Bear | Moderate | $0.0009–$0.0016 | Momentum fades, exploit fears return | Daily trade above $0.002863 |
Likelihood labels are qualitative. No probability model backs them.
Disclaimer
This article is for educational and informational purposes only and isn't financial advice. Cryptocurrency prices are highly volatile, forecasts can be wrong, and losses can exceed expectations. Independent research and a licensed advisor should guide any investment decision.
0
0

 Verwalten Sie alle Ihre Kryptowährungen, NFTs und DeFi an einem Ort
Verbinden Sie sicher das Portfolio, das Sie zu Beginn verwenden möchten.


