Ethereum Price Trapped in Symmetrical Triangle as Monthly Chart Shows Bearish Double Top

0
0
Ethereum ETH $2 418 24h volatility: 0.9% Market cap: $291.88 B Vol. 24h: $15.69 B is flashing a long-term warning as its monthly chart reveals a double top formation near $4,000, a key resistance area rejected twice since 2021.
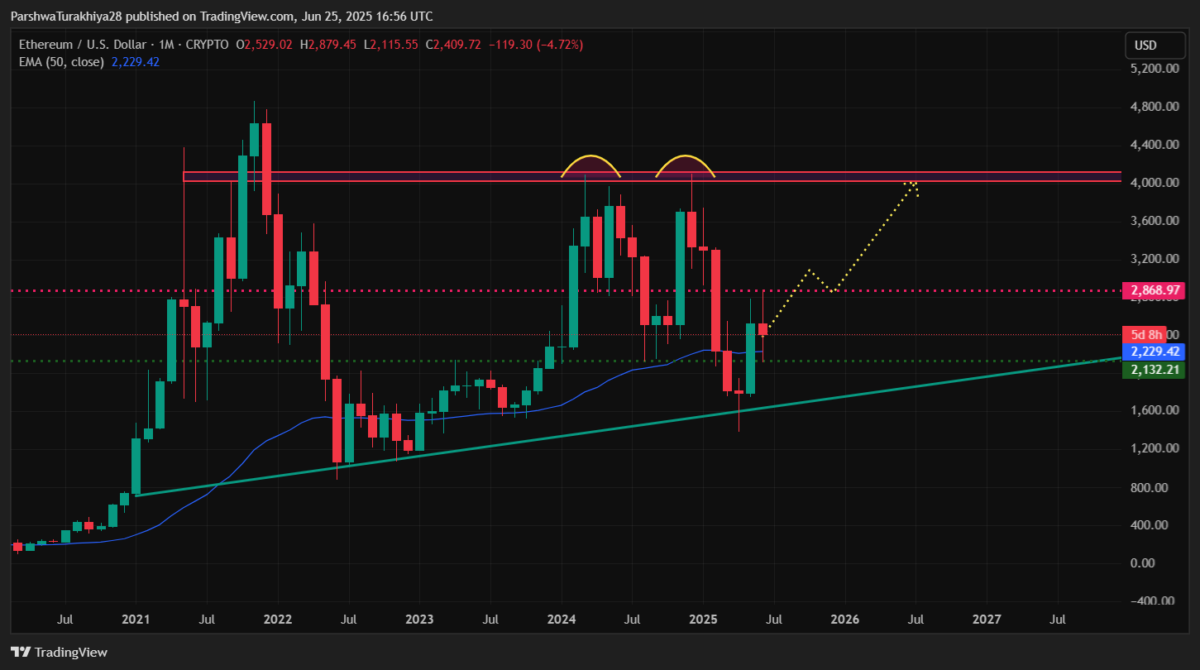
ETH price dynamics | Source: TradingView
The asset is still trading above the multi-year trendline that began from the 2020 lows. Dynamic support is seen around the 50-month EMA at $2,229, where the most recent bounce occurred. Ethereum price is now trading near $2,424, but traders are watching the neckline at $2,130–$2,200 for any signs of breakdown.
Symmetrical Triangle Keeps ETH Locked Below Key Resistance
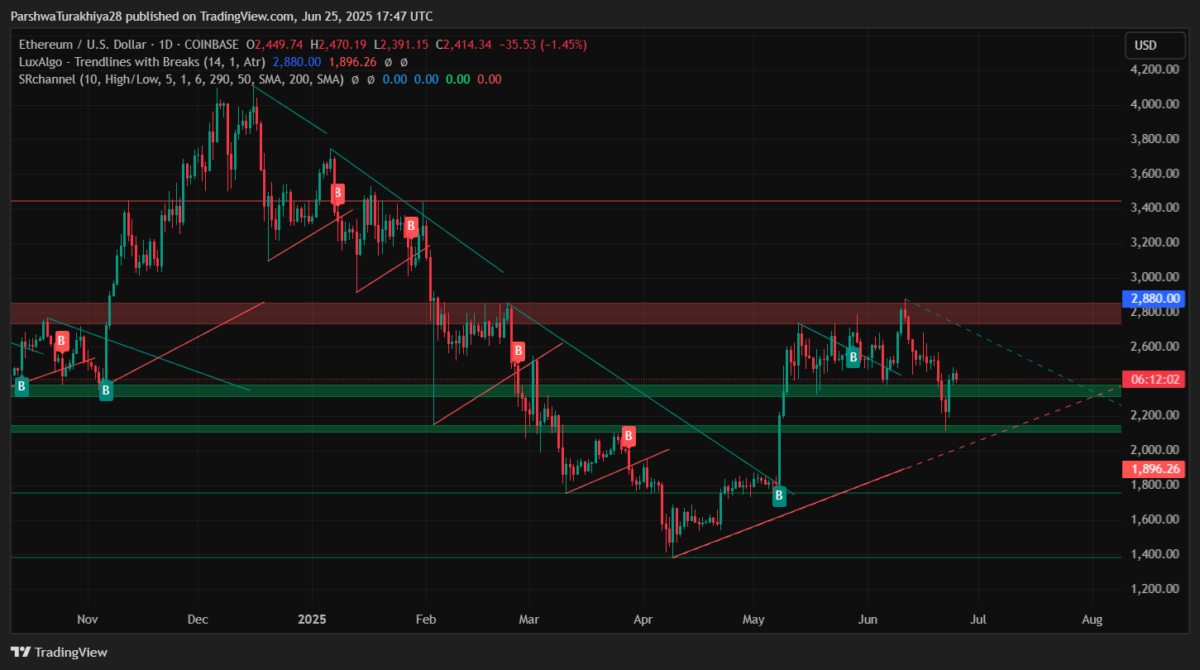
ETH price forecast | Source: TradingView
On the daily chart, ETH remains stuck inside a symmetrical triangle. Price recently rebounded from $2,220 but is capped by descending resistance at $2,520. RSI is near 46 and MACD remains negative, showing no momentum shift yet. Bollinger Bands are compressing, hinting at low volatility before a potential breakout.
A decisive move above $2,525 could flip the trend bullish. Until then, Ethereum price remains in a broader range between $2,200 and $2,870. Volume has been muted throughout, pointing to accumulation rather than distribution.
Despite near-term volatility, some market participants remain highly optimistic. A recent projection shared by Crypto GEMs suggests Ethereum could reach $50,000 within five years, based on long-term channel trend analysis.
$ETH #Ethereum could hit $50,000 in the next 5 years
— Crypto GEMs 📈🚀 (@cryptogems555) June 21, 2025
Long Liquidations Outpace Shorts
According to liquidation data, Ethereum saw $28.25 million in long liquidations over the past day, more than double short-side liquidations at $11.91 million.
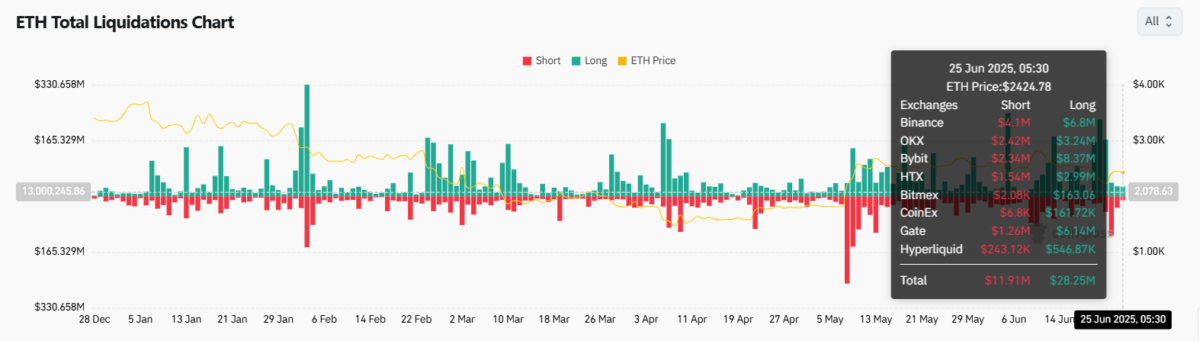
ETH liquidation chart | Source: Coinglass
Bybit led long-side liquidations at $8.37 million, while Binance topped the short side with $4.1 million.
These figures suggest that long-side leverage had overheated around the $2,500 mark, triggering liquidations as price failed to extend upward.
Spot Outflows Add to Short-Term Bearish Tone
Netflows show $44.13 million in ETH outflows from exchanges, typically a bullish sign. But paired with the liquidation pressure and stagnant price action, this likely reflects risk-off repositioning rather than accumulation.
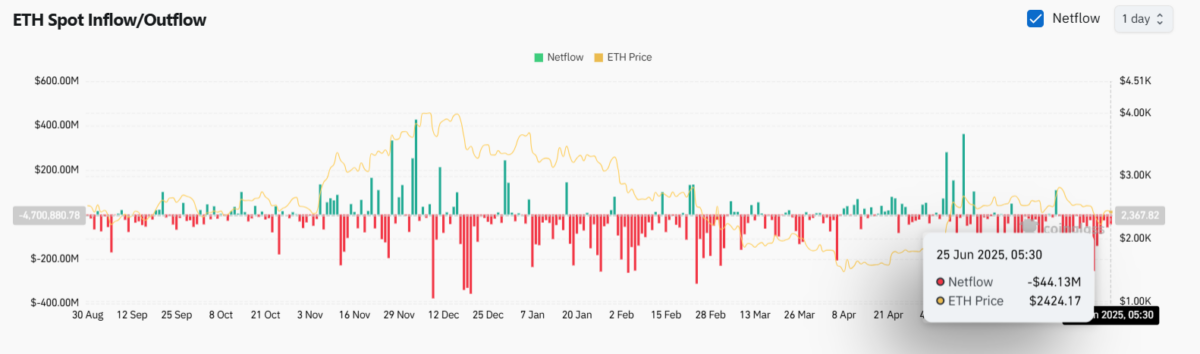
ETH net inflows/outflows | Source: Coinglass
Until Ethereum reclaims $2,870 or holds firmly above $2,300, the bias remains neutral to bearish in the short term. The monthly chart remains a critical inflection point, with bulls needing to defend $2,200 to maintain structure.
Ethereum recently rebounded from $2,131 following a major whale accumulation exceeding $8.9 million, which helped lift price back toward the $2,400 level.
Best Wallet Gains Investor Attention As Ethereum Consolidates
While Ethereum remains range-bound, traders seeking diversification are turning to Best Wallet, a self-custodial app offering multichain support, real yield, and AI-based asset tracking.

With over 100,000 downloads and support for Ethereum, Solana, and BNB Chain, Best Wallet is emerging as a go-to platform for secure Web3 interaction. Learn more and download now at Best Wallet.
The post Ethereum Price Trapped in Symmetrical Triangle as Monthly Chart Shows Bearish Double Top appeared first on Coinspeaker.
0
0

 Manage all your crypto, NFT and DeFi from one place
Securely connect the portfolio you’re using to start.


