Experts Reveal Buy Zone for HYPE as Traders Fear a Potential $107M Sell-off

0
0
Hyperliquid’s HYPE HYPE $52.99 24h volatility: 1.0% Market cap: $14.37 B Vol. 24h: $532.69 M token slid 2% on September 16 as traders fear a potential $107 million whale sell-off ahead. A whale who bought and staked 2 million HYPE nine months ago has begun moving funds.
According to data shared by LookOnChain, the whale originally deposited $17.4 million USDC through three wallets, acquiring HYPE at an average price of $8.68.
After splitting the tokens across nine wallets for staking, the whale applied to unstake a week ago and received the tokens on September 15.
A whale who bought and staked 2M $HYPE(cost $17.4M, now worth $107.2M) 9 months ago at $8.68 avg has now unstaked it and is very likely to sell for profits!
9 months ago, this whale deposited 17.4M $USDC into #Hyperliquid through 3 wallets and bought 2M $HYPE at $8.68 avg, then… pic.twitter.com/1DTkfWSqrQ
— Lookonchain (@lookonchain) September 16, 2025
At the time of writing, HYPE, one of the top crypto coins, is trading around $52.6, positioning the investor’s holdings at $107.2 million. This represents a paper profit of nearly $89.8 million and raises the chances of a sizable sell-off.
Meanwhile, another major investor who already realized over $50 million in profits recently opened a 3x leveraged short on 303,901 HYPE, roughly $16 million. Analysts say this move points to growing bearish sentiment in the short term.
Current HYPE Price: A Good Entry Point?
Despite the pressure, HYPE continues near the midpoint of a rising parallel channel that has been in place since late July. Crypto market watchers suggest that if HYPE revisits its channel’s lower boundary, $50 and $47 are key support levels to buy the dip.
Many believe that the ongoing price downturn is offering attractive entry points before a rally. This comes as Hyperliquid prepares to launch its USDH stablecoin, expected to bolster long-term confidence in HYPE price surge.
On the daily chart, the RSI currently hovers around the neutral zone suggesting a tie between bulls and bears.
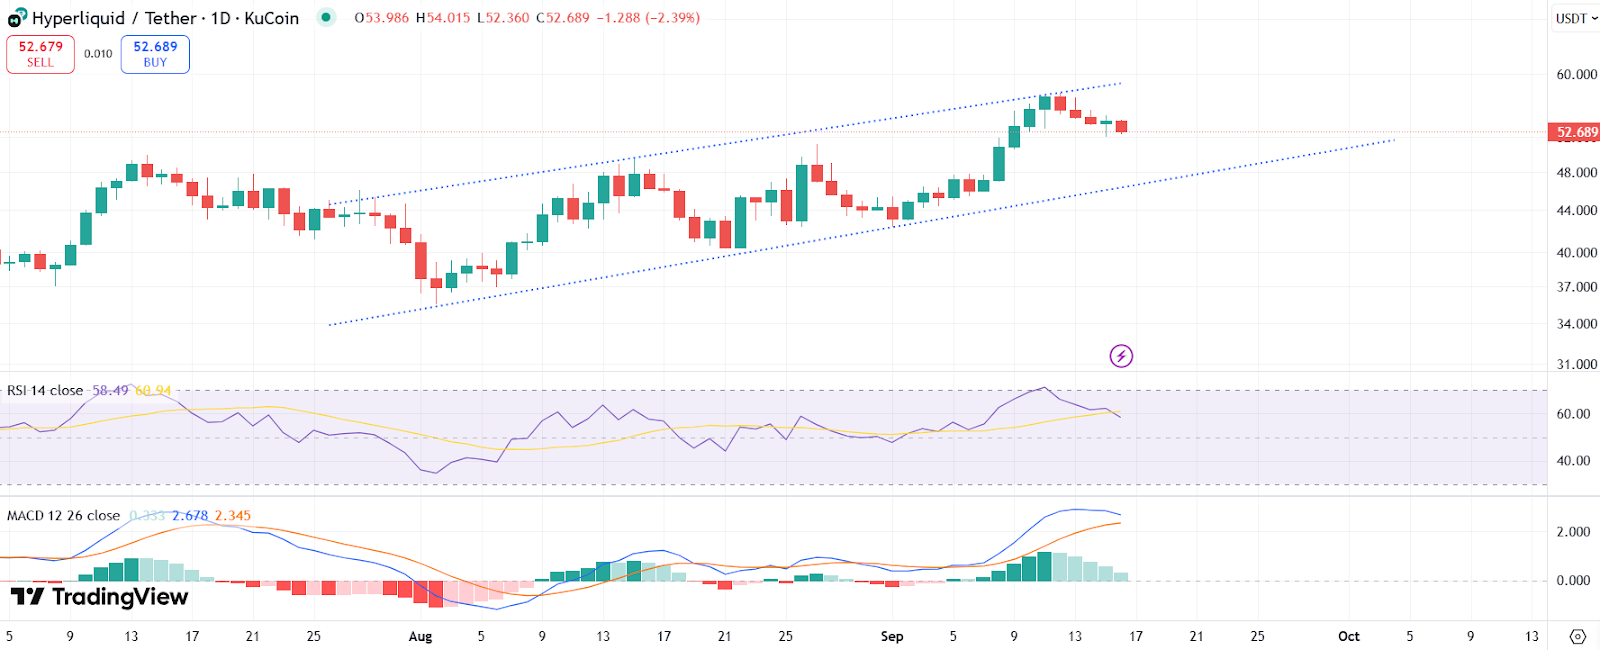
HYPE price chart with RSI and MACD. | Source: Trading View
Meanwhile, the MACD line is narrowing toward the signal line, hinting at weakening bullish momentum. A bearish crossover would confirm short-term downside toward the $50-$47 support zone.
However, if the MACD resumes upward motion, traders could see resistance near $55 and a potential HYPE price surge to $60, the top of the trending channel.
The post Experts Reveal Buy Zone for HYPE as Traders Fear a Potential $107M Sell-off appeared first on Coinspeaker.
0
0

 Manage all your crypto, NFT and DeFi from one place
Securely connect the portfolio you’re using to start.

0
0


