How Far Will Ethereum (ETH) Price Rally From Here?

0
0

Key Insights
- Ethereum (ETH) price climbed above $2,600 as on-chain signals point to strong support between $2,513 and $2,536.
- Exchange reserves remain close to all-time lows, showing limited selling pressure.
- Spot ETF inflows are steadily building, pressuring a breakout past $2,650.
Ethereum (ETH) has quietly broken back above the $2,600 mark, a level it’s struggled to hold for weeks. This time, the backdrop looks stronger. On-chain metrics, exchange data, and ETF flows all suggest that the ETH price is standing on firmer ground. The question now is whether this move can stretch into a broader rally.
Whales Defend Ethereum Price’s $2.5K Zone With Full Force
Glassnode’s latest Cost Basis Distribution Heatmap shows that over 3.45 million ETH has a cost basis in the $2,513–$2,536 zone. That means this is where most long-term buyers accumulated, and many of them are currently sitting in small profits. This zone is now acting as a psychological and technical floor; buyers don’t want to sell here.

The denser the heatmap lines at a price level, the stronger the hands holding it. In this case, multiple yellow-to-green bands reinforce the idea that whales and funds are defending this zone hard. That’s a bullish signal because when whales buy and hold, they tend to support price stability during volatile periods.
Cost basis distribution is essentially a visual map of how much ETH was bought at specific price levels. The more ETH that has a cost basis at a certain level, the stronger that level becomes as support.
ETF Net Inflows Keep Fueling the Bid
ETF inflows have been quietly building. According to the latest data from Coinglass, net spot Ethereum ETF inflows have shown strong green prints throughout late June and early July. These aren’t yet explosive flows, but they are consistent, and consistency is key.
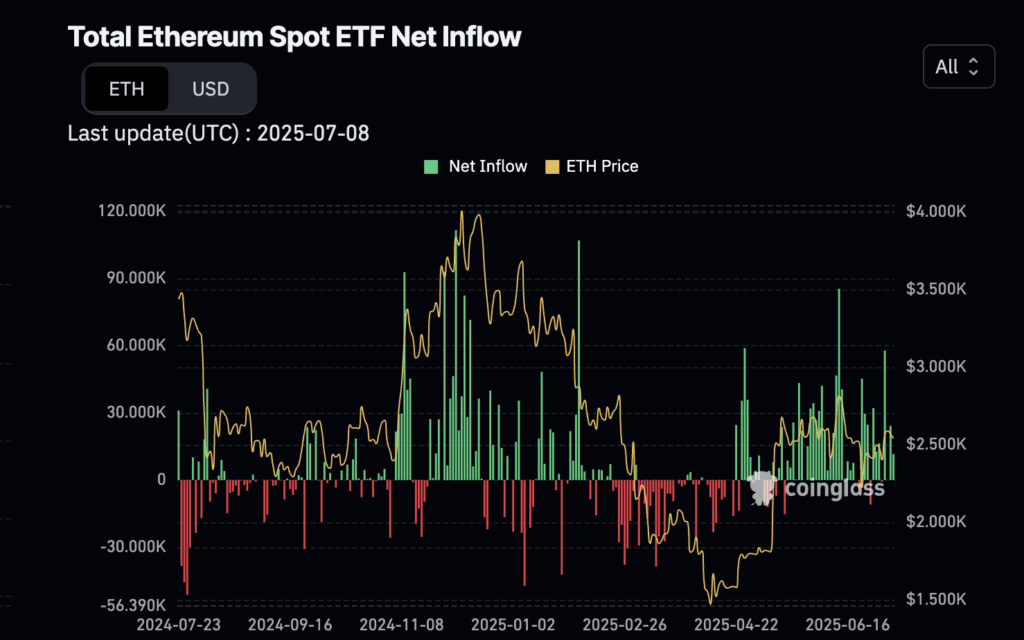
On days with higher inflows, ETH price tends to bounce. This pattern has repeated itself for weeks. With the U.S. market opening up to more ETH-based products, including the anticipated launch of new custodial structures, the flows could increase rapidly.
Spot ETF inflows are funds entering the market through officially listed investment products, often driven by institutions. Inflows signal fresh buying interest that can soak up available supply.
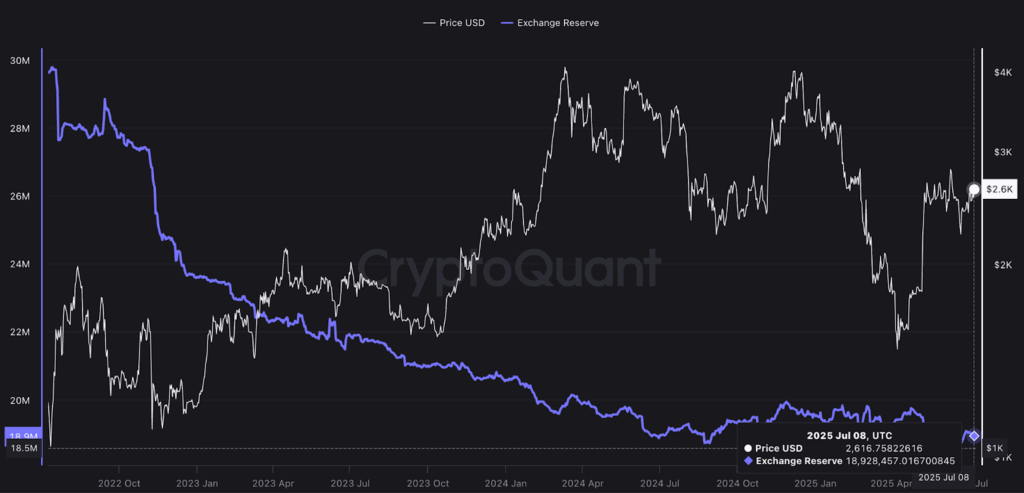
Exchange Reserves Are Still Near Record Lows
Ethereum’s total exchange reserves have fallen to just under 19 million ETH, as per CryptoQuant. While not the absolute bottom, this level is extremely low historically. Back in mid-June, reserves were just slightly lower, so current levels suggest that traders are still hesitant to send ETH back to exchanges.
Low exchange reserves usually mean fewer tokens are available for immediate selling. When demand picks up, like it has with ETFs or on-chain accumulations, prices can move faster due to limited supply.
In short, whales are holding, exchanges are dry, and ETFs are filling the gap. That’s a powerful combination.
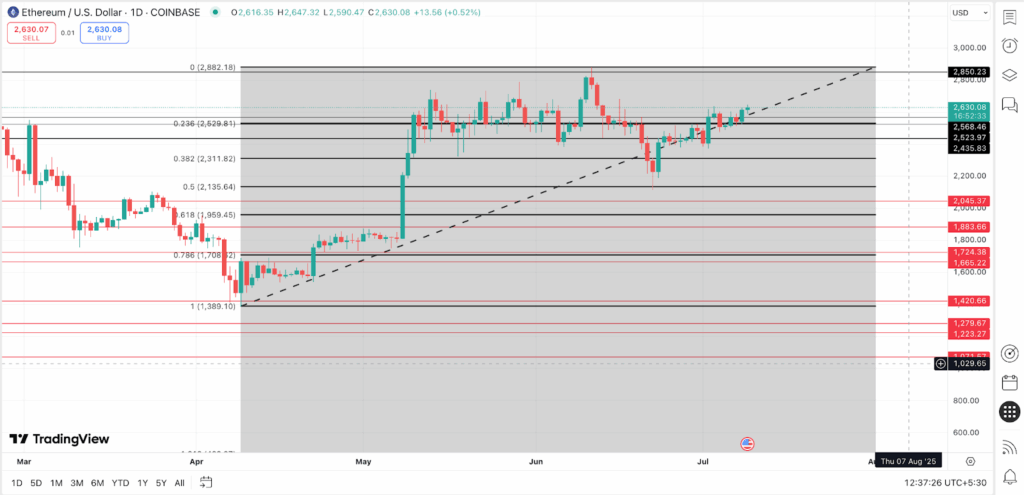
Fibonacci Targets Suggest Ethereum (ETH) Price Upside to $2,850
Looking at the ETH/USD chart on Coinbase, Fibonacci retracement levels suggest the key resistance was around $2,529, which has now been breached successfully. Based on the chart levels, there aren’t many strong resistance zones beyond that.
The next psychological and structural resistance comes in at $2,850, also suggested by the Fibonacci indicator, also a prior high from early June. If ETH price clears $2,650 with volume, momentum could easily carry it to this level.
With buyers protecting the $2,500 zone, exchange reserves tight, and ETF flows supporting demand, the current Ethereum price structure leans bullish.
Any pullback to $2,520–$2,540 will likely be bought quickly unless the macro changes drastically. As long as ETH holds above this zone, the path of least resistance remains upward.
The post How Far Will Ethereum (ETH) Price Rally From Here? appeared first on The Coin Republic.
0
0

 Manage all your crypto, NFT and DeFi from one place
Securely connect the portfolio you’re using to start.

0
0


0
0