America’s Debt Now Exceeds GDP — Is This the Silent Catalyst Bitcoin Was Waiting For?

0
0


America’s debt now exceeds GDP — and Bitcoin may have been built for exactly this moment. The Committee for a Responsible Federal Budget confirmed that debt held by the public reached $31.27 trillion at the end of Q1 2026.
Against trailing 12-month nominal GDP of $31.22 trillion — a ratio of 100.2%, the first crossing of this line since World War II.
Federal interest payments have now overtaken defense spending as the single largest line item in the U.S. budget. There is no credible political path to reversing the trend.
Why Bitcoin? The Hard-Money Case Gets Harder to Dismiss
BlackRock, in its Bitcoin diversifier paper, stated that long-term adoption could be shaped by concerns over monetary stability, fiscal sustainability, and U.S. political stability.
As of May 1, 2026, approximately 20.02 million BTC are in circulation against a hard cap of 21 million — a fixed supply that stands in direct contrast to a fiscal system that can issue unlimited debt.
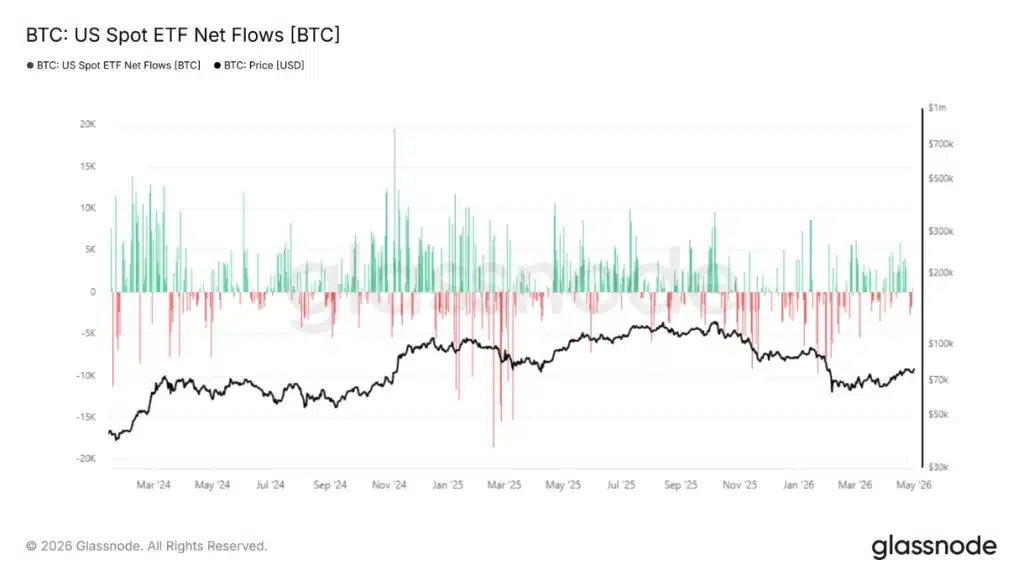
Institutional demand appears to be tracking the logic. Bitcoin spot ETFs broke a three-day outflow streak on April 30, recording $14.75 million in net inflows — a sign that large buyers are treating macro dislocations as entry points rather than exits.
Pressure Building — Here’s What the Charts Are Signalling
BTCUSD Daily (1D): As of May 03, 2026 (07:41 UTC), Bitcoin trades at $78,397.90, well off its cycle high of $125,761.31.
The Bollinger Bands are tightening — upper at $79,642.39, mid-SMA at $76,717.31, lower at $73,792.22 — with price pressing the upper band.
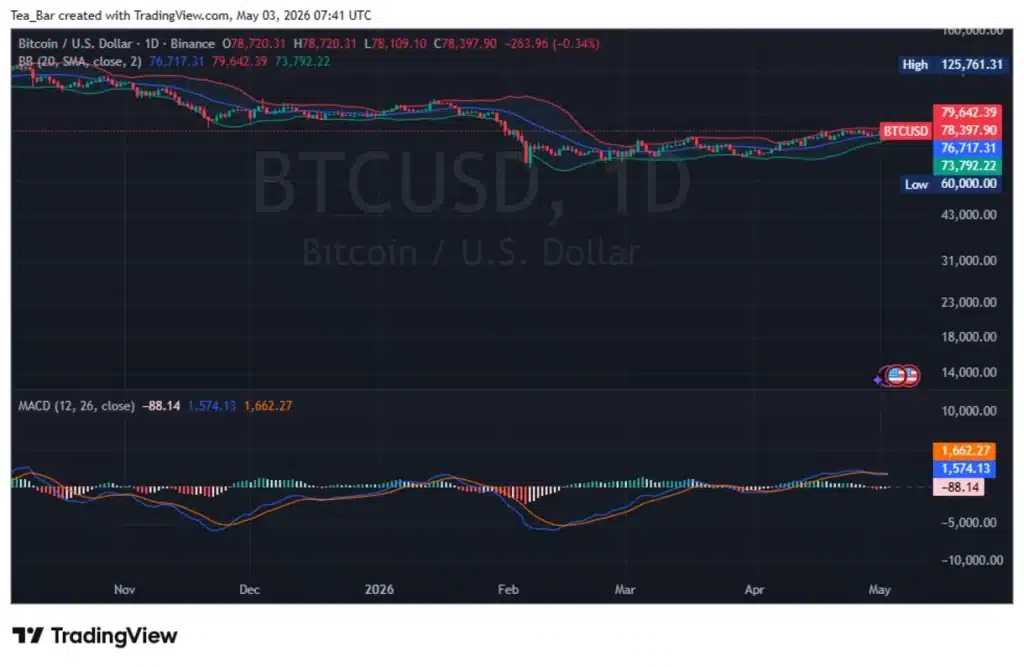
The daily MACD is the standout: with the MACD line at 1,574.13 and the signal at 1,662.27, the histogram sits at just -88.14.
That near-zero separation, after a prolonged bearish phase, is a textbook pre-crossover compression.
When this gap closes on the daily chart mid-recovery, it has historically preceded sustained directional moves rather than simple bounces.
BTCUSD Weekly (1W): The weekly SAR at $82,949.39 remains above price, keeping the macro trend technically bearish. But the MACD line has curled sharply upward to +1,660.07, while the signal holds deep at -6,053.21.
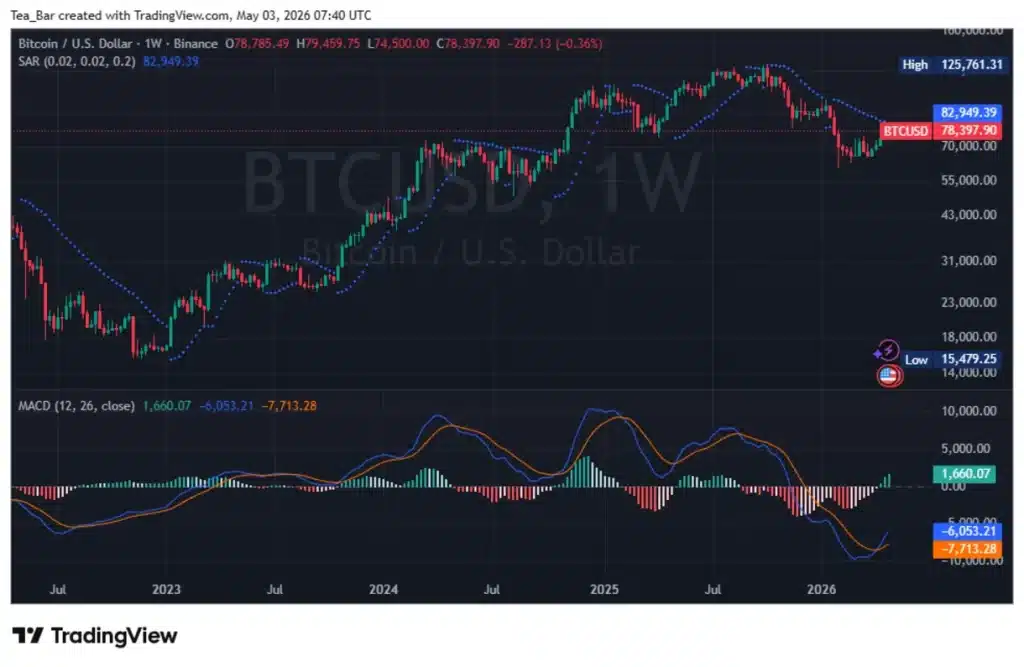
On the weekly chart, this kind of MACD reversal from deeply negative territory — clearly visible after February’s capitulation — has been one of Bitcoin’s most reliable early signals of a macro trend shift. The crossover isn’t confirmed yet. But the line is moving.
The Bottom Line
Three things will determine if this debt milestone converts into real buying pressure: market liquidity conditions, the direction of Treasury yields, and observable flows through ETFs and on-chain accumulation.
The macro backdrop is building. The charts are compressing. And somewhere in all of that, one wonders — was the asset with a hard cap of 21 million coins quietly designed for the exact moment a government owes more than its economy produces?
Disclaimer:
This article is for informational purposes only and does not constitute financial, investment, or trading advice. The views expressed are based on publicly available data, market observations, and the author’s interpretation at the time of writing. Cryptocurrency markets are highly volatile and unpredictable, and past performance or current technical setups do not guarantee future results. Readers should conduct their own research and consult with a qualified financial advisor before making any investment decisions. TechGaged does not accept liability for any losses incurred based on the information presented.
The post America’s Debt Now Exceeds GDP — Is This the Silent Catalyst Bitcoin Was Waiting For? appeared first on TechGaged.com.
0
0

 Manage all your crypto, NFT and DeFi from one place
Securely connect the portfolio you’re using to start.


0
0

0
0

0
0